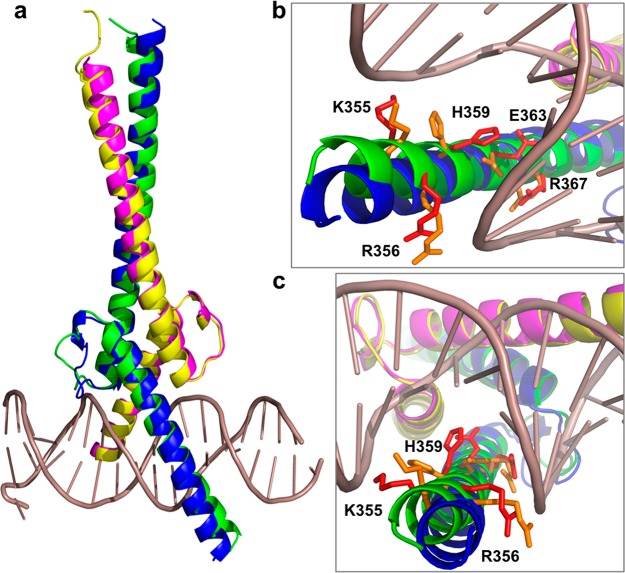
Figure 7.
Cartoon representations of the superposition of the crystal structures of the c-MYC:MAX complex in its apo form and bound to DNA. (a) Overall view of the superimposition of the highest-resolution structure (PDB entry 6G6K) with c-MYC colored blue and MAX colored magenta and the 1NKP structure with c-MYC colored green and MAX colored yellow. (b and c) Details of the MYC basic region with residues K355, R356, H359, E363, and R367 that make contact with DNA shown as red sticks, and the same residues are colored orange in the crystal structure of the apo form.

