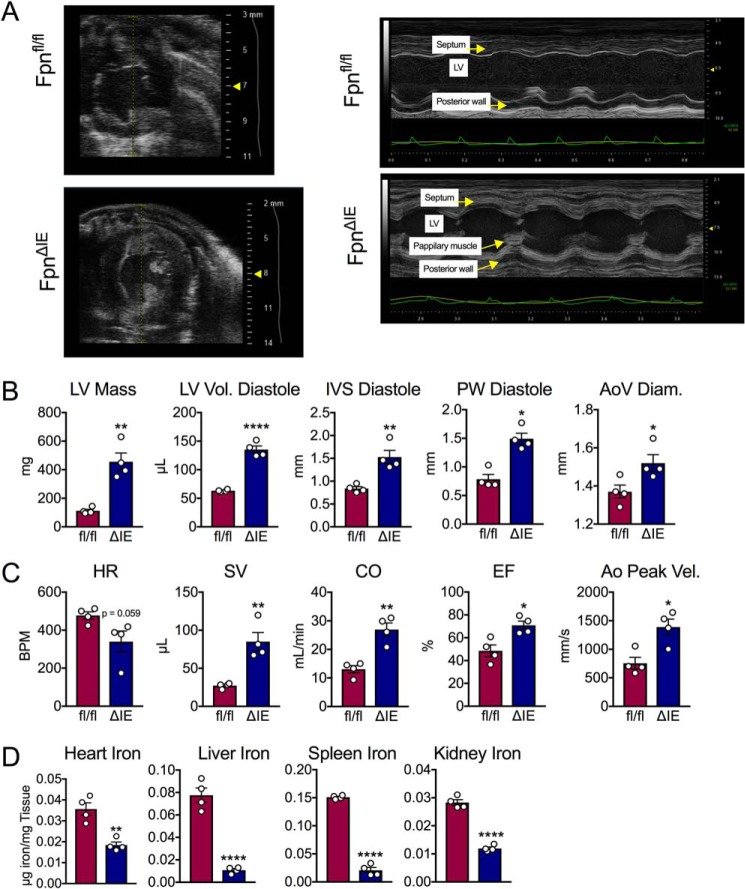
Figure 5.
Echocardiogram analysis of iron deficiency anemia reveals cardiomegaly and disruption of cardiac function. A, M-mode images from echocardiogram analysis in Fpnfl/fl and FpnΔIE mice with end-stage iron deficiency anemia. B, quantification of cardiac structure parameters: left ventricular mass (LV Mass), left ventricular volume at diastole (LV Vol. Diastole), interventricular septum width at diastole (IVS Diastole), posterior wall thickness at diastole (PW Diastole), and ascending aorta diameter (AoV Diam.). C, quantification of cardiac function parameters: heart rate (HR), stroke volume (SV), cardiac output (CO), ejection fraction (EF), and aorta velocity peak gradient (Ao Peak Vel.). D, heart, liver, spleen, and kidney iron content. All data are from mice 6 months post-tamoxifen treatment. Mean ± S.E. are plotted. Significance was determined using two-tailed unpaired t test. *, p < 0.5; **, p < 0.01; ****, p < 0.0001 compared between Fpnfl/fl and FpnΔIE cohorts

