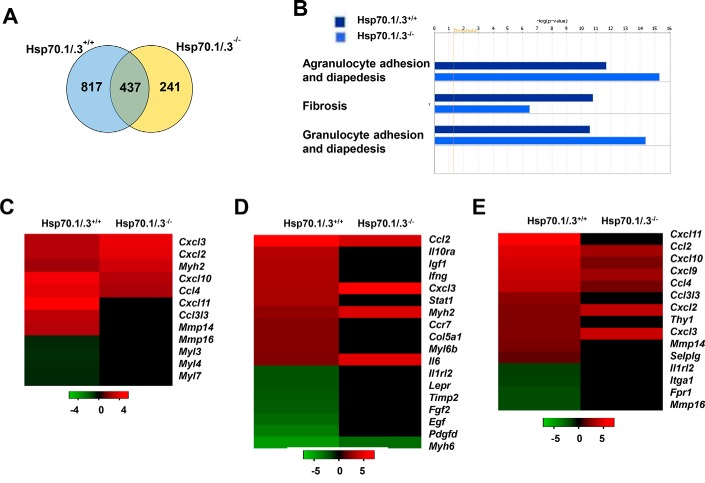
Figure 4.
Comparative analysis of up- or down-regulated genes in the lungs of WT and Hsp70.1/.3−/− mice during SEA-induced allergic airway inflammation. A, Venn diagram of the ratio of gene expression (SEA/saline) obtained in the lungs isolated from sensitized WT and Hsp70.1/.3−/− mice. Venn diagrams were obtained using raw data and filtering genes that were at least 1.5-fold up- or down-regulated when comparisons were made within each animal group and between the two following conditions: antigen challenge and saline challenge. B, the microarray data were analyzed by Ingenuity Pathway Analysis software, and the top three pathways of differential gene expression between the WT and Hsp70.1/.3−/− mice are shown. C–E, the heat maps present the expression change of genes involved in the agranulocyte adhesion and diapedesis (C), fibrosis (D), and granulocyte adhesion (E) pathways.

