
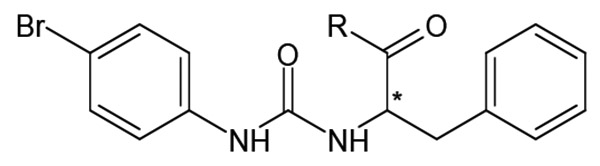
Table 7.
Agonist Activity of Chiral N-phenylurea Derivatives 34-38 [80]
 |
|||||
|---|---|---|---|---|---|
| # | R | EC50 (μM)a | |||
| FPR1 | FPR2 | FPR3 | PMN | ||
| 34 | 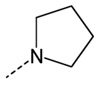 |
4.5 | 0.14 | 11.5 | 3.2 |
| 35 | 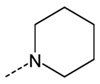 |
1.8 | 0.04 | 6.5 | 1.2 |
| 36 |  |
0.3 | 0.004 | 0.1 | 0.7 |
| 37 |  |
0.08 | 0.007 | 0.5 | 0.5 |
| 38 | 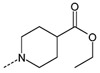 |
N.A. | 0.16 | N.A. | 4.4 |
a
EC50 values were determined by measurement of Ca2+ flux in FPR1-, FPR2-, and FPR3-transfected
HL-60 cells or in human polymorphonuclear neutrophils (PMN). N.A., no activity observed.