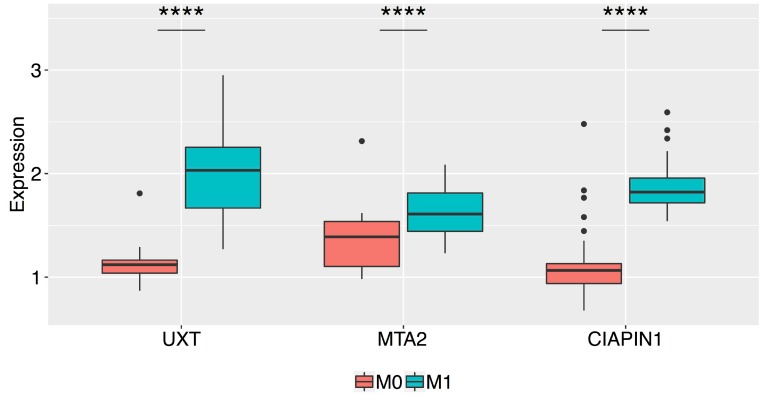
Figure 2. Box plots of the normalized relative expression of the UXT, MTA2, and CIAPIN1 proteins in the gastric tumor tissue of patients without metastasis (M0) and with metastasis (M1) (**** P < 0.0001).
The boxes are drawn from the 75th percentile to the 25th percentile. The horizontal line inside the box represents median values. The vertical lines above and below the box delineate the maximum and minimum values, and the dots indicate outliers.

