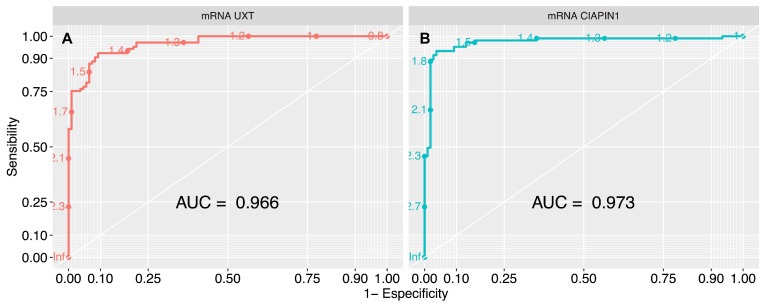
Figure 5. ROC curve analysis to define the cut-off values of UXT and CIAPIN1 gene expression, segregating the high and low expression groups.
The largest total area under the curve (AUC) is 0.966 for (A) UXT gene (that represents normalized expression cut-off of 1.5), and 0.973 for (B) CIAPIN1 gene (cut-off of 1.7). ROC, receiver-operating characteristic.

