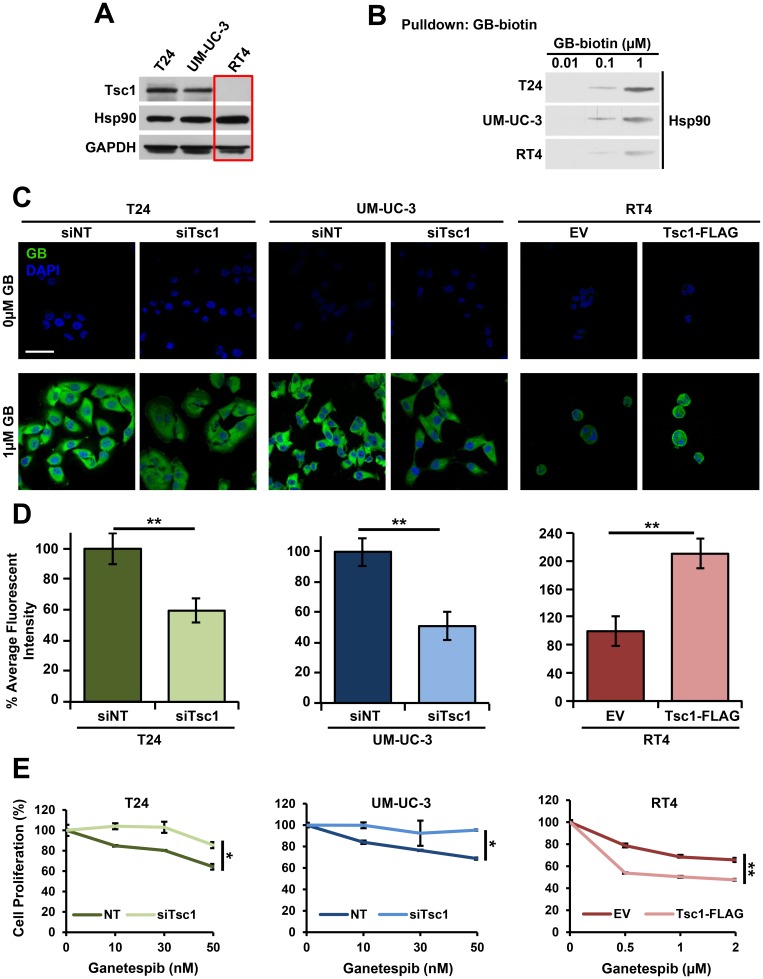
Figure 1. Tsc1 expression determines Hsp90 inhibitor accumulation and sensitivity in bladder cancer cells.
(A) Tsc1 status in T24, UM-UC-3 and RT4 bladder cancer cell lines was assessed by immunoblot. GAPDH was used as a loading control. (B) Lysates from Figure 1A were challenged with biotinylated-ganetespib. Binding of Hsp90 from T24, UM-UC-3 and RT4 cells to biotinylated-ganetespib was examined by immunoblot. (C) TSC1 was targeted by siRNA in T24 and UM-UC-3 cells and Tsc1-FLAG was transiently expressed in RT4 cells. Representative confocal microscopy images of these cells treated for 4hr with BODIPY-ganetespib at the indicated concentrations and stained with DAPI. Scale bar = 50 μm. (D) Quantification of average fluorescence intensity of BODIPY-ganetespib in (C). A Student’s t-test was performed to assess statistical significance (** p < 0.01). (E) TSC1 was targeted by siRNA in T24 (left) and UM-UC-3 (center) and Tsc1-FLAG was transiently expressed in RT4 (right) cells for 48 hr. Following this, cells were treated for an additional 72 hr with the indicated concentrations of ganetespib. Cell proliferation was assessed by WST proliferation assay. A Student’s t-test was performed to assess statistical significance (* p < 0.05; ** p < 0.01).

