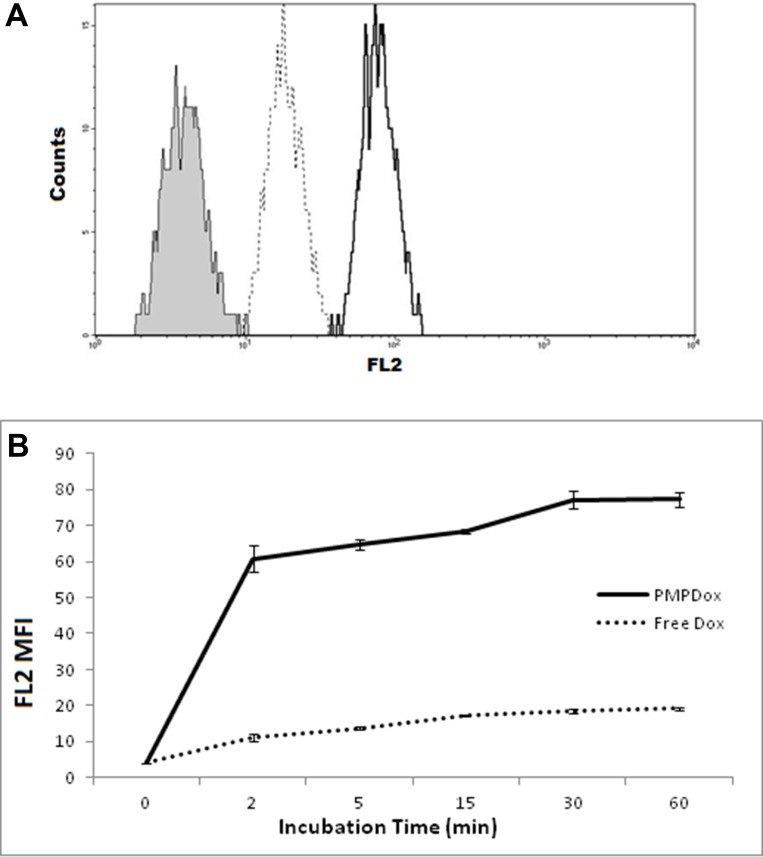
Figure 3.
(A) uptake of doxorubicin by HL 60 cells following 60 min incubation with equivalent doses of either PMPDox (solid margin, unshaded) or free Dox (dotted margin, unshaded) studied by flow cytometry. Shaded curve represents HL 60 cells before exposure to drug. The figure is representative of 3 independent experiments. (B) Dox uptake by HL 60 cells at different time points. Graph represents mean ± SD from 3 independent experiments.

