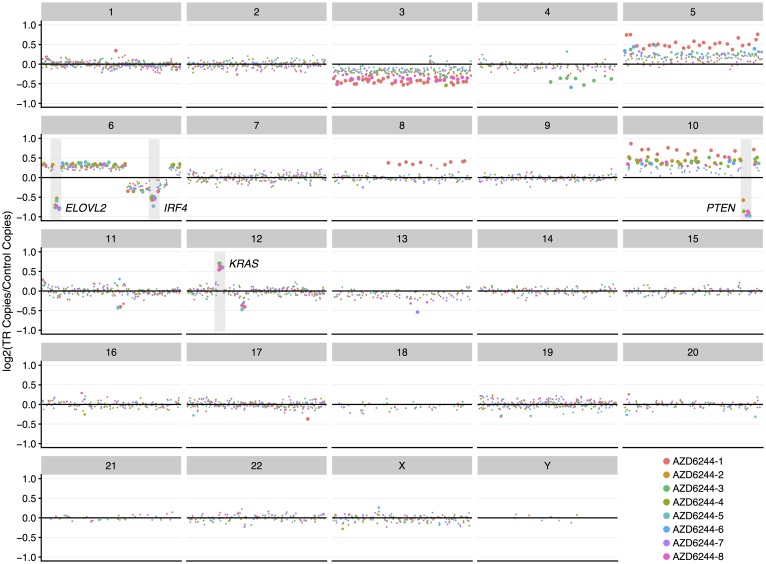
Figure 1. Copy number changes acquired during generation of MEKi-resistant phenotype.
Copy number variation analysis of all TR populations revealed amplification and deletion events common to all samples which are known to be associated with cancer and/or drug resistance. These events include deletion of PTEN, IRF4, and ELOLV2 and amplification of KRAS. TR copy changes are shown relative to DMSO controls. Each panel describes copy changes for the chromosome indicated in the title bar. Circle size indicates the statistical significance of the difference in gene copies (Bonferroni-adjusted p-values); large circles represent p < 0.001, medium circles represent 0.001 < p < 0.05; and small circles represent p ≥ 0.05. Circle colour represents replicates.

