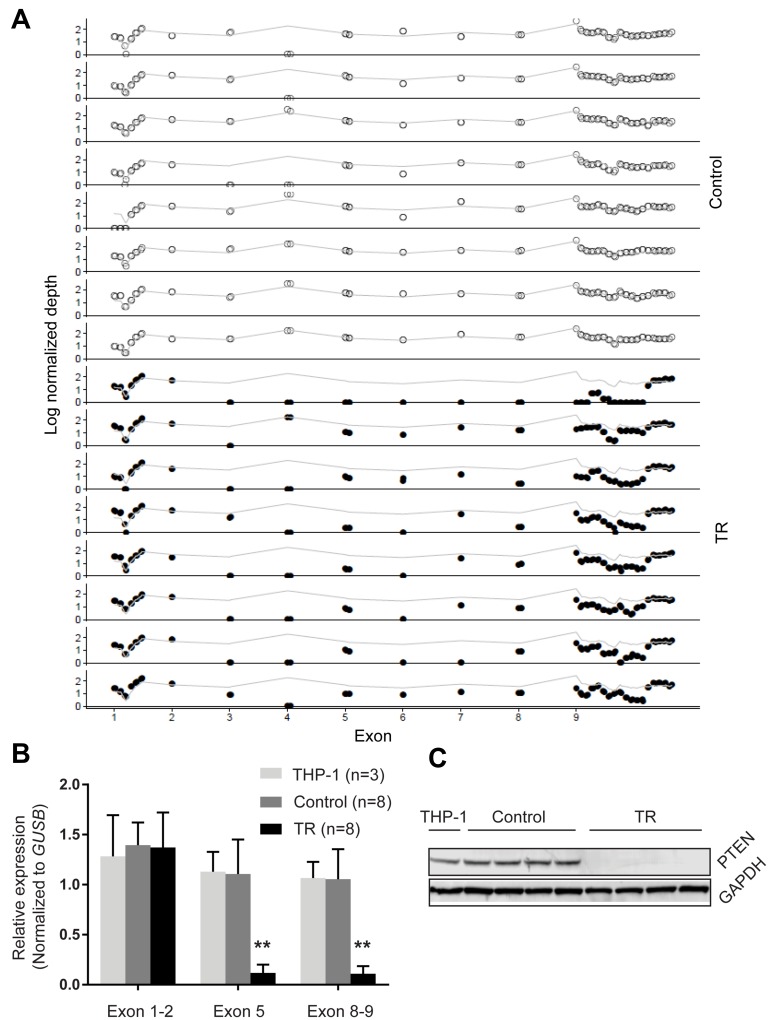
Figure 2. PTEN loss in TR cells.
(A) Copy number changes of PTEN exons. Normalized depth (log) of each probe targeting PTEN (indicated by o and •) was obtained by targeted exome sequencing. Grey line indicates the average depth of the entire locus. Dots above and below the grey line indicate gain and loss in copy numbers, respectively, at the targeted locus. (B) qPCR analysis of PTEN expression. The transcriptional levels of the exon 1–2, exon 5 and exon 8–9 of PTEN were determined by qPCR and normalized to GUSB. (C) Representative western blot of PTEN levels in the parental cells (lane 1), control cells (2–5) and resistant cells (6-9). GAPDH (37 kD) was used as a loading control for each blot. Data are presented as mean and standard deviation. **p < 0.01 (t-test, two-tailed).

