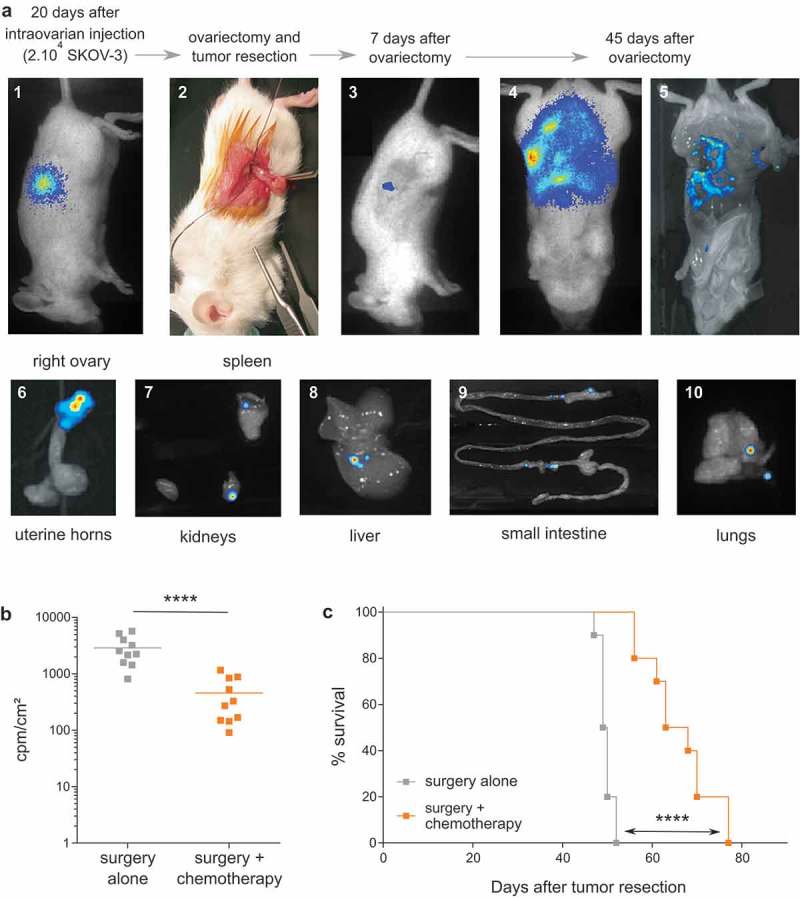
Figure 2.

Establishment of a preclinical orthotopic human EOC mice model. (a) Representative optical and bioluminescence pictures showing the chronological development of orthotopic EOC xenografts (pictures 1 to 5) and subsequent peritoneal carcinosis (pictures 6 to 10) in NSG mice. (b) Bioluminescence analysis of mice performed at day 45 after tumor resection in surgery (surgery alone) or surgery combined to intraperitoneal injection of chemotherapy at days 10, 12, 14 and 16 after surgery (surgery + chemotherapy) (n = 10 mice; **** p < 0.0001). Results are expressed as cpm/cm2. (c) Survival curves of mice treated by surgery alone (-■-) or surgery and chemotherapy (-■-) (n = 10 mice per group; Log rank analysis, **** p < 0.0001).
