
Figure 5.
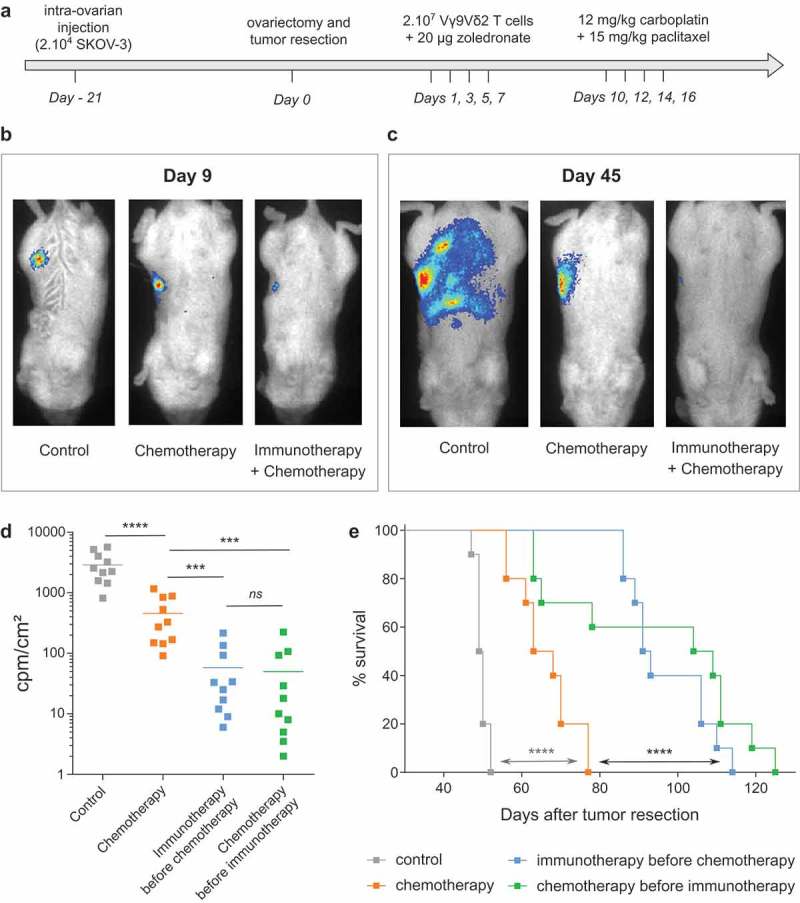
in vivo combination of chemotherapy and immunotherapy strongly improves EOC mice survival. (a) Design of the trial. (b-c) Representative bioluminescence pictures of one mice per group at day 9 (b) and day 45 (c) after tumor resection. (d) Compiled results of bioluminescence intensities for each group. (n = 10 mice; *** p < 0.001). (e) Survival curves of control mice (-■-), mice treated by chemotherapy (-■-), immunotherapy before chemotherapy (-■-) or chemotherapy before immunotherapy (-■-) (n = 10 mice per group; Log rank test, **** p < 0.0001).