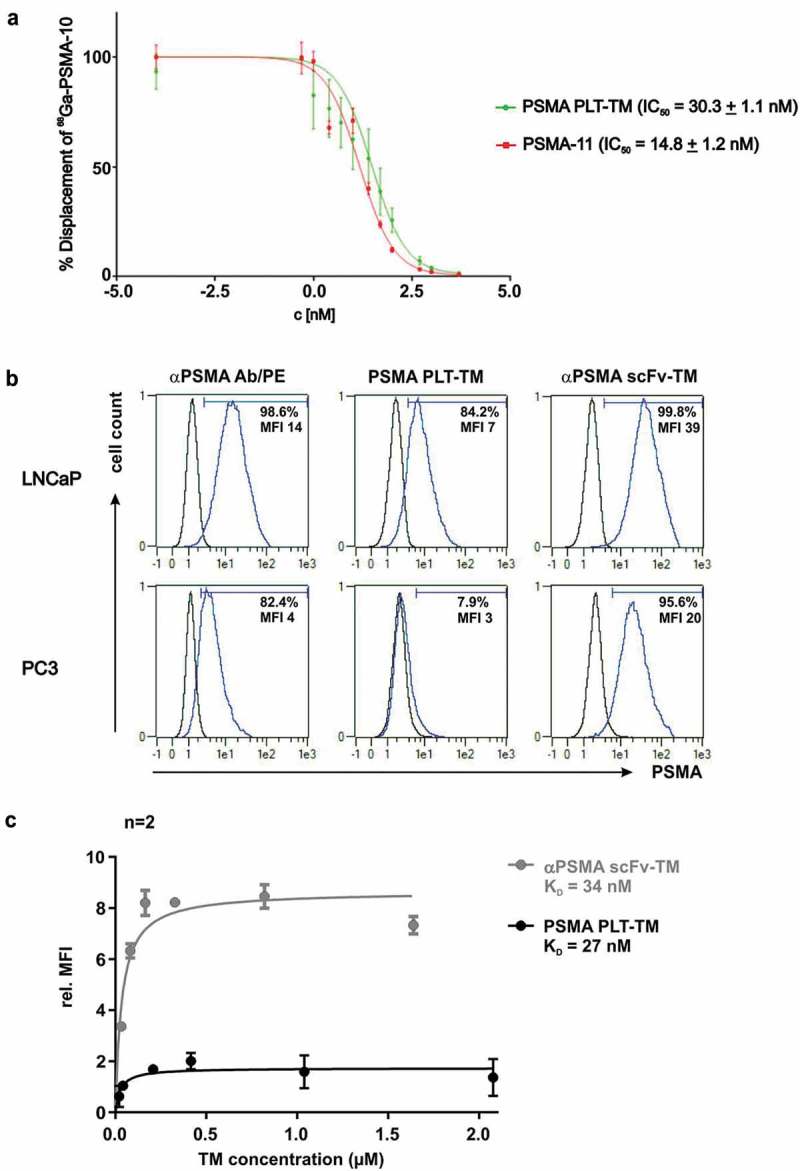
Figure 3.

Binding analysis of PSMA PLT-TM. (a) Displacement curves of 68Ga-PSMA-10 (30 nM) bound to PSMA expressed on LNCaP cells (105 cells per well). Results are expressed as % specific cell-bound radioactivity after incubation (45 min, RT) with increasing concentrations of non-radiolabeled PSMA-PLT TM or PSMA-11. The IC50 values are expressed as mean ± SD. Experiments were performed in quintuplicate. (b) 2 × 10⁵ LNCaP or PC3 cells were incubated with 20 ng/µL TM. Binding was detected using the mouse anti-E5B9 and PE-labeled goat anti-mouse IgG Abs. In addition, cells were stained with mouse anti-human PSMA Ab/PE as positive control. Histograms show stained cells (blue line) and respective negative controls (black line). Percentage indicate proportion of PSMA+ cells under the marker. (c) For comparison of the binding affinity of the novel PSMA PLT-TM with the scFv-based αPSMA scFv-TM increasing amounts of the respective TM were incubated with LNCaP cells. The binding was estimated by flow cytometry. Relative median of fluorescence intensity (MFI) values were plotted against the concentration. Mean ± SEM of two different experiments is shown. KD values were calculated from the binding curves.
