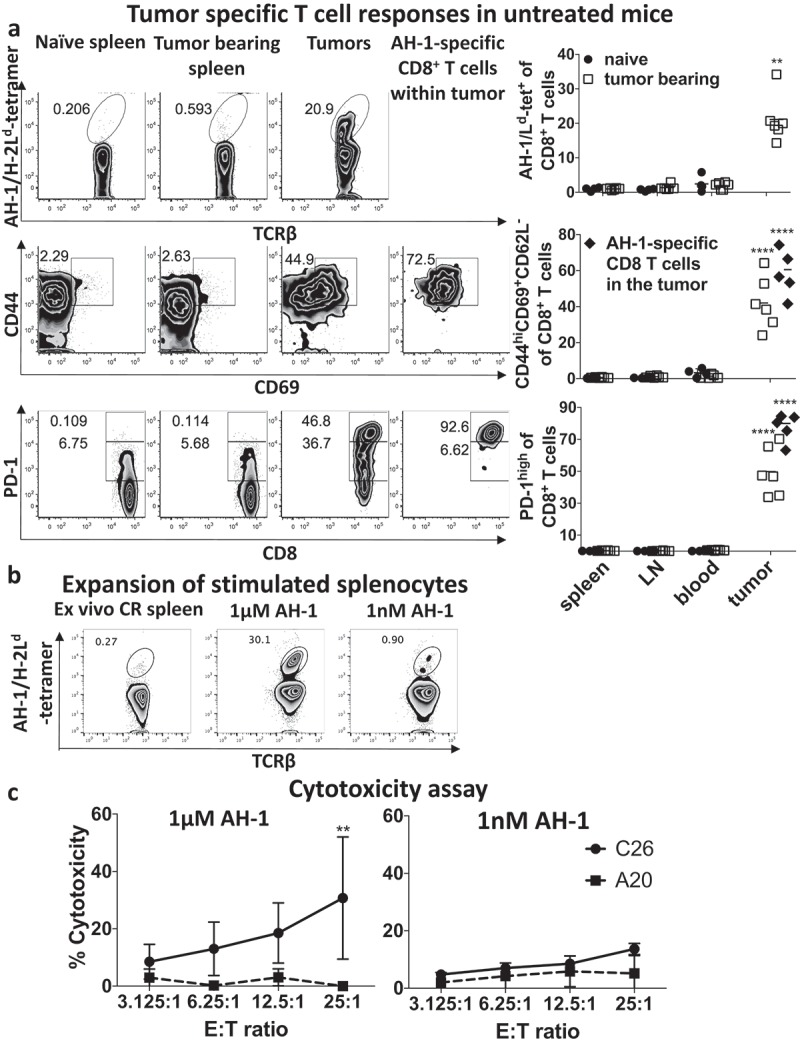
Figure 3.

PD-1hi, CD44hiCD69+ AH-1-specific CD8+ T cells were induced by growth of untreated C26 tumors.
a) Mice with bulky (1000mm3) C26 tumors (untreated) as well as naïve controls (n = 4–6/group) were bled and euthanized to harvest and prepare single cell suspensions of tumors, spleen and draining lymph nodes (LN). Lymphocytes were stained for AH-1/Ld-tetramer reactive populations (top panel), activation markers (CD44hiCD69+CD62−, middle panel) and PD-1 expression (lower panel) on CD8+ T cells and analyzed by flow cytometry. Individual responses and mean values are shown of pooled data from two experiments. Kruskal–Wallis with Tukey post hoc test was performed and indicated that AH-1 specific CD8+ T cells are significantly enriched (p < 0.01) in the tumor compared to the periphery (blood, spleen or lymph nodes) of tumor-bearing or naive mice. Total tumor CD8+ T cells and AH-1 specific CD8+ T cells were significantly more activated (p < 0.0001) and expressed higher levels of PD-1 (p < 0.0001) than in the periphery of tumor-bearing or naïve mice. b) Splenocytes, harvested from mice with CR, were stimulated for one week with high (1 μM, left graph) or low (1 nM, right graph) AH-1 peptide concentration with syngeneic BALB/c splenocytes as antigen-presenting cells. Lymphocytes were stained for AH-1/Ld-tetramer reactive CD8+ T populations. c) Lactate dehydrogenase (LDH) cytotoxicity assay was performed with expanded splenocytes. For this, C26 cells were applied as AH-1 expressing target (T) cells (solid line). A20 cells were utilized as an AH-1 negative target cell line (dashed line). These cells were incubated with different ratios of CD8+ effector (E) T cells for 4 h and LDH assay was performed to calculate cytotoxicity. Mean ± standard deviation is shown of three pooled experiments. Two-way ANOVA with Sidak’s multiple comparison test was performed and showed significant difference (**p < 0.01) at the 25:1 ratio. Representative flow cytometry plots (bottom) illustrate the expansion of AH-1 specific CD8+ T cells.
