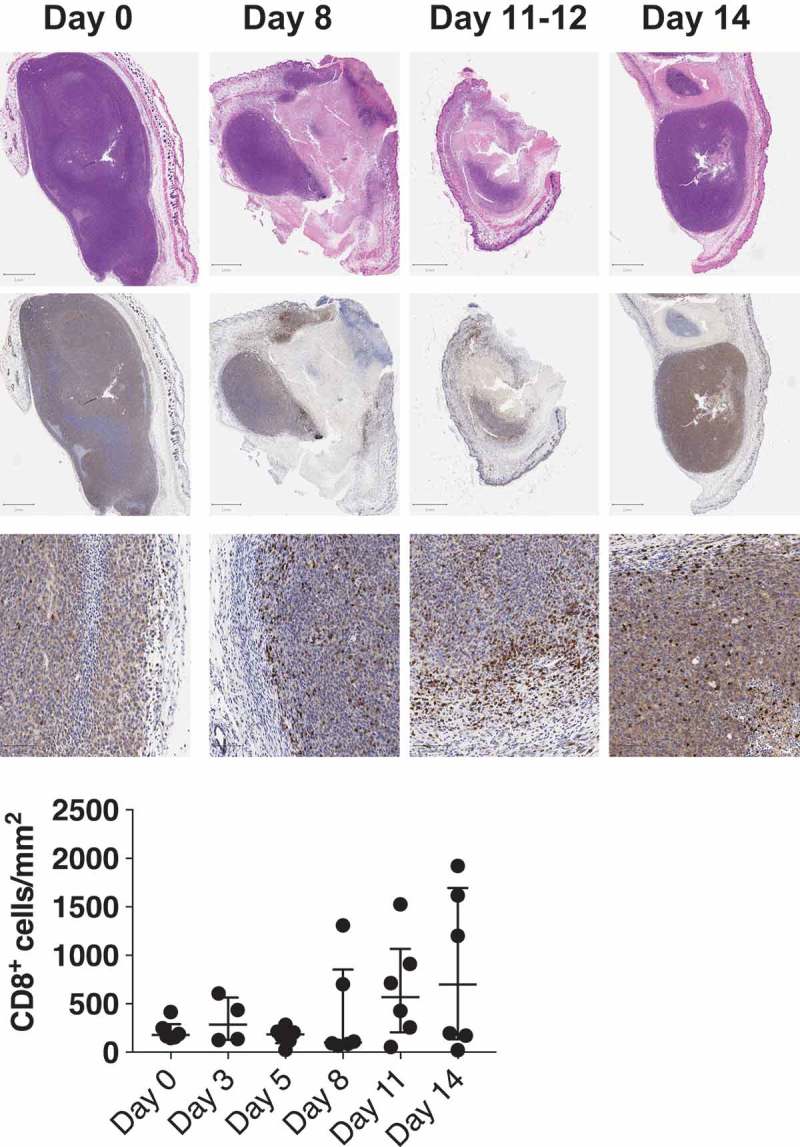
Figure 4.

CD8+ T cells infiltrate increases 11 days after treatment onset.
Top panel shows representative images of histology of C26 tumors before treatment (day 0) and after treatment (day 8, 11–12 and 14). H&E staining is depicted in the top row, CD8+ T cells are presented in the middle and bottom row at different magnifications (see scale bar). The bottom graph is a quantification of CD8+ T cells per mm2 of tumor tissue (n = 6 per time point). Each point represents a different mouse tumor, as mice has to be euthanized to harvest tumors at each time point. The 12 specimens at days 11 + 14 differ from those at the earlier time points (p = 0.04) by a Kruskal–Wallis test.
