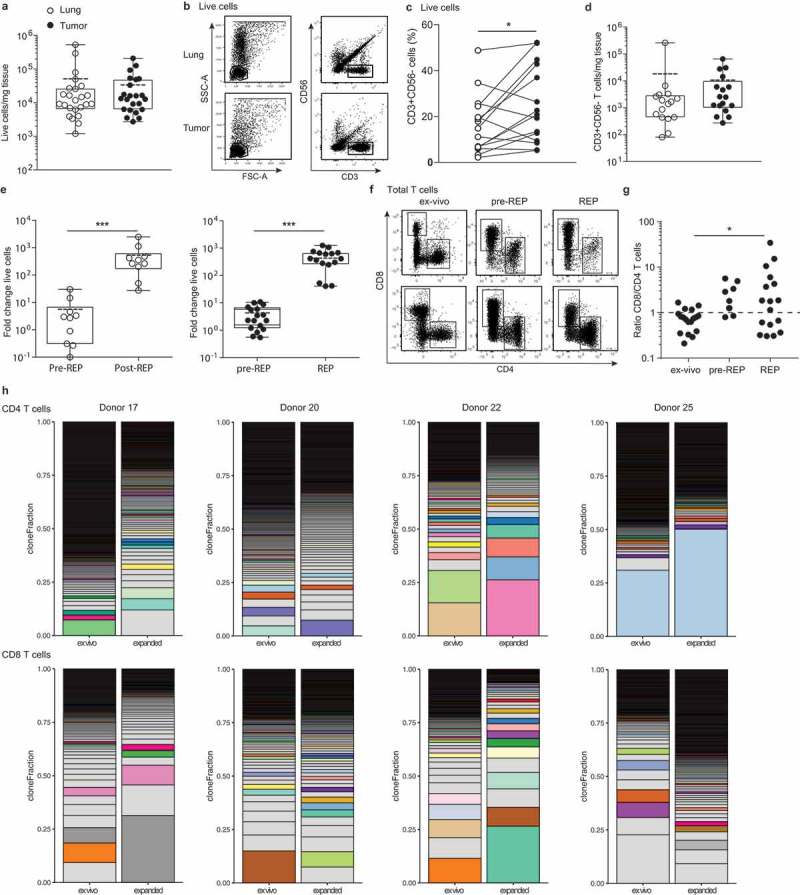
Figure 1.

Effective isolation and expansion of TILs from NSCLC-derived lesions. Single cell suspensions were obtained from distal lung tissue and tumor sections of 23 donors directly after resection. (a) Numbers of life cells/mg tissue. Dead cells were excluded by trypan blue. Each dot represents one donor, box and whisker plots depict the mean (dotted line), minimum and maximum values (whiskers) and 25th pct and 75th pct (box). (b) Gating strategy of CD56−/CD3+ T cells and lymphocytes, and (c) percentage of CD3+ cells within the lymphocyte population in tumor and lung, to calculate (d) the numbers of T cells/mg tissue by flow cytometry, depicted as in (A). (e) Of 9 normal lung tissues (left panel), and of 17 tumor tissues (right panel), single cell suspensions were cultured for 10–13 days with 6000IU/ml IL-2 (pre-REP), followed by 2 weeks of culture with 30ng/ml anti-CD3, feeder mix, and 3000IU/ml IL-2 (REP). The fold change of total cell count was determined from the number of cells used as input. (f, g) The ratio of CD8+ over CD4+ T cells of the CD3+ T cells was determined by flow cytometry in tumor digests directly ex vivo, and after pre-REP and REP cultures. (a, c, d, e and g) Significance was calculated with paired student’s T test; * p < .05; *** p < .001. If no indication, p ≥ 0.05. (h) T cell clonality was determined by CDR3 sequencing of the TCRb chain of FACS-sorted CD4+ and CD8+ T cells from tumor digest and from corresponding expanded TILs (CD25hiCD127hi CD4+ T cells containing the Treg population were excluded from this analysis). Relative individual T cell clone frequency ordered from the largest (bottom) to the smallest (top). Color-coded pairs represent shared TCR sequences, light-grey bars depict non-shared TCR sequence.
