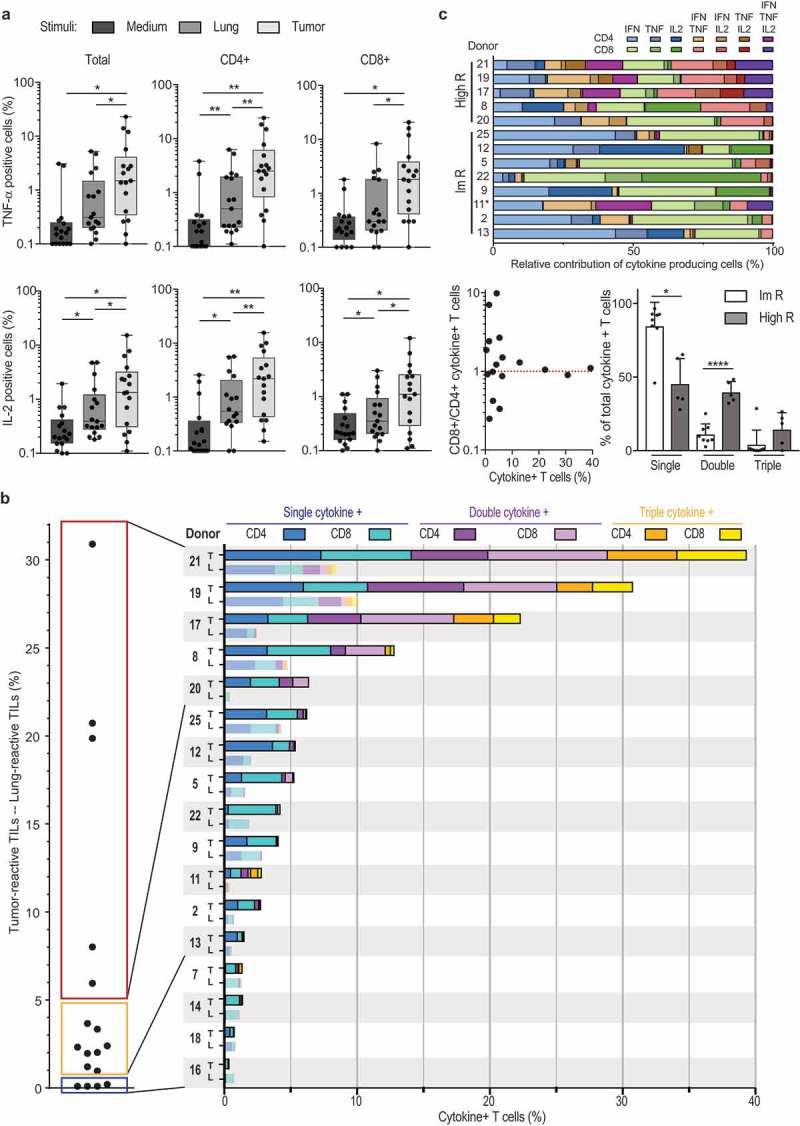
Figure 4.

NSCLC-derived TIL products can be polyfunctional. (a) Percentage of TNF and IL-2 production of T cells (left panel), CD4+ T cells (middle panel) and CD8+ T cells (right panel) as determined by flow cytometry, n = 17 donors. Each dot represents one donor, box and whisker plots depict minimum, 25th pct, median, 75th pct and maximum values. (b) Left panel: Percentage of cytokine-producing T cells that were cultured with tumor digest, minus the percentage of cytokine production of T cells stimulated with lung digest (n = 17). Right panel: Total percentage of cytokine producing T cells. The percentage of cytokine producing CD4+ T cells (dark colors) and CD8+ T cells (light colors) is depicted when exposed to tumor digest (top bar), or to the lung digest (bottom bar). Color coding indicates the production of 1 (blue) 2 (purple), or 3 (yellow) cytokines simultaneously. Each patient is indicated with a number. (c) Top: Relative contribution of cytokine production profile of high and intermediate responders depicted in panel B. non-responders were excluded from this analysis. Bottom left: Ratio of tumor reactive CD8+ over CD4+ T cells, in relation to the percentage of cytokine-producing T cells. Bottom right: relative contribution of single, double and triple cytokine producers in high responders (high R), and intermediate responders (Im R) as defined in panel B.
