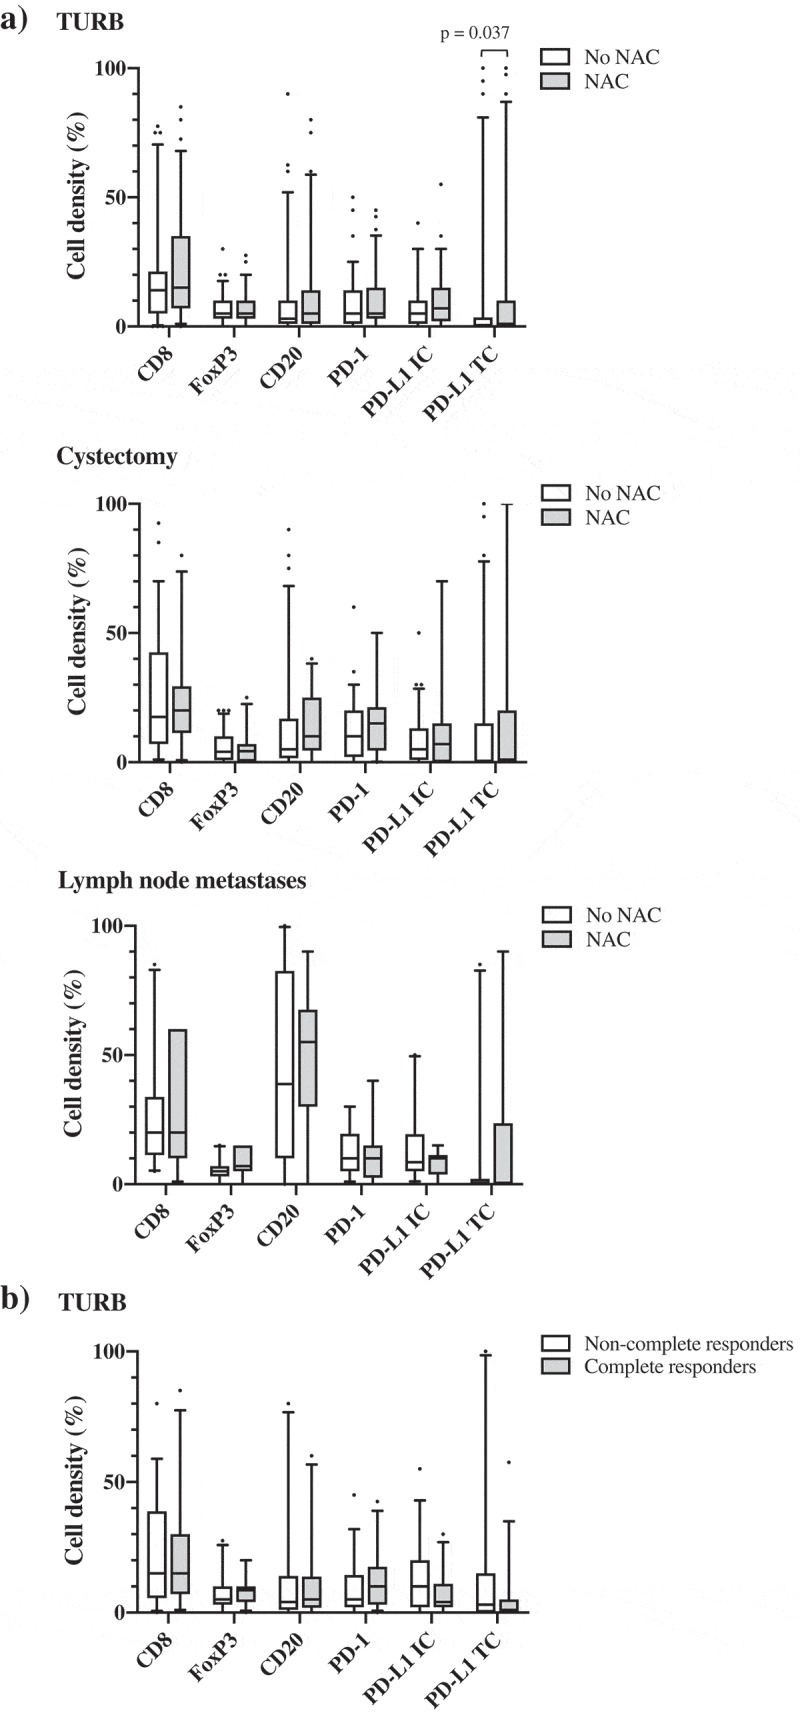
Figure 3.

Distribution of immune cell density and PD-L1TC in strata according to neoadjuvant chemotherapy and histopathological response to treatment. A) Densities of different immune cell subsets in tissue specimens from NAC untreated (n = 80) and treated (n = 65) patients. B) Densities of different immune cell subsets prior to NAC treatment in complete (i.e. T-stage 0 or Ta/CIS) and non-complete (i.e. T-stage ≥1) responders. Whiskers represent 5% and 95%.
