
Figure 4.
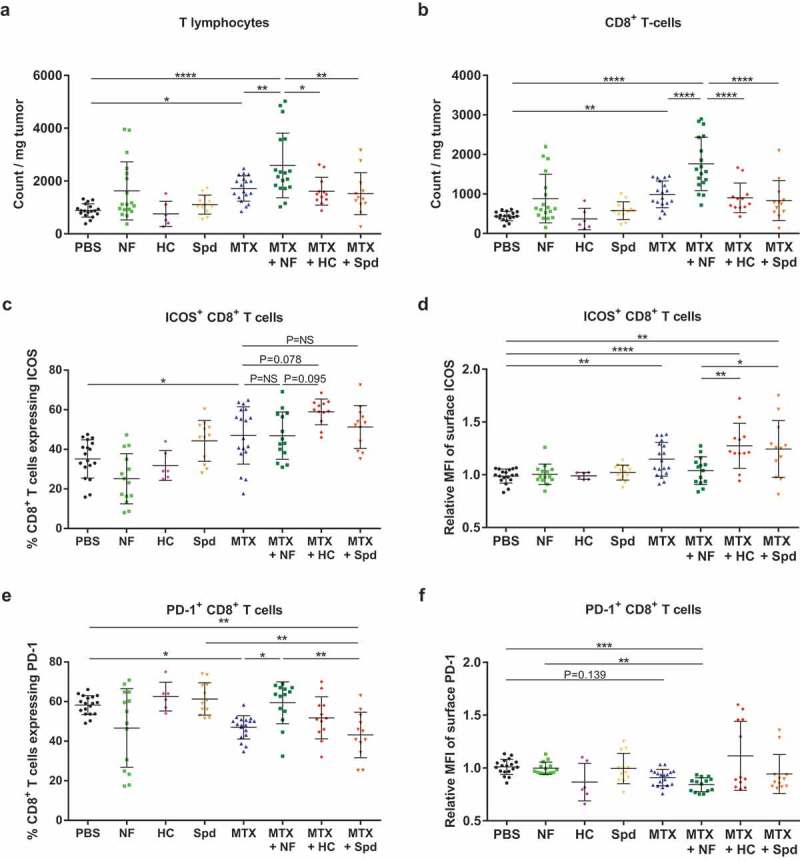
CRMs modulate tumor-infiltrating lymphoid cell subsets. Following the experimental schedule illustrated in Figure 3(a), T cell populations infiltrating the tumor microenvironment were analyzed by flow cytometry. (a) Total population of T lymphocytes (CD3+). (b) Total population of CD8+ T cells. (c) Percentage of CD8+ T cells expressing the early activation marker ICOS. (d) Level of expression of ICOS at the surface of CD8+ T cells (relative MFI). (e) Percentage of CD8+ T cells expressing the late activation/exhaustion molecule PD-1. (f) Level of expression of PD-1 at the surface of CD8+ T cells (relative MFI). Dot plots illustrate mean ± SD. ****p< .0001, ***p< .001; **p< .01, *p< .05; p= NS, not significant. For a detailed account of all comparisons, see Supplemental Table 4. HC, hydroxycitrate; ICOS, inducible T-cell costimulator; MFI, mean fluorescence intensity; MTX, mitoxantrone; NF, nutrient-free; PBS, phosphate-buffered saline; PD-1, programmed cell death protein 1; Spd, spermidine.