
Figure 7.
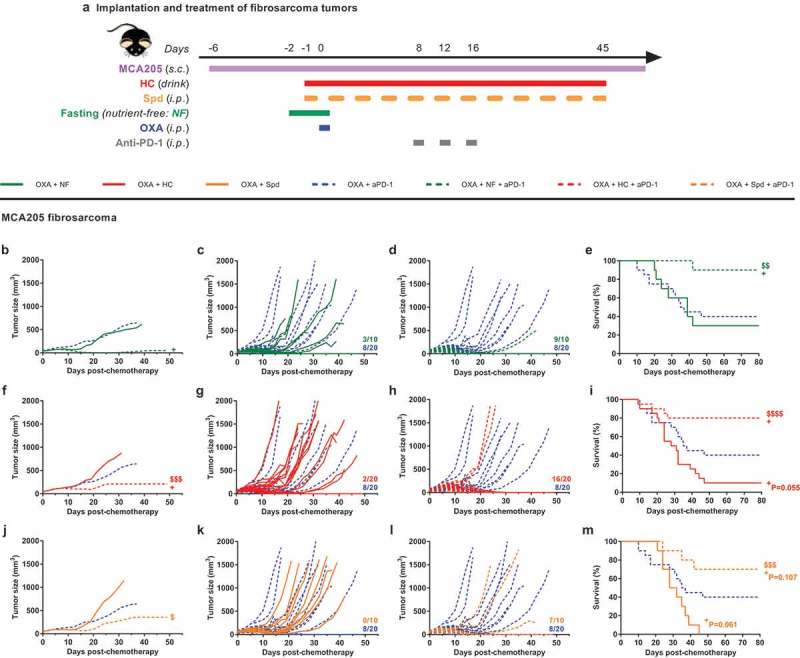
CRMs improve OXA + anti-PD-1 bitherapy. Experimental schedule of the implantation and treatment of syngeneic subcutaneous fibrosarcoma in C57Bl/6 mice (a). When tumors reached ~20 mm3, mice were randomly assigned to the different treatment groups. Monotherapy regimens consisted of: (i) PBS (untreated control mice) or (ii) OXA-based chemotherapy. Bitherapies consisted of: (i) OXA + NF, (ii) OXA + HC, (iii) OXA + Spd, and (iv) OXA + anti-PD-1. Anti-PD-1 was also evaluated in a tritherapy regimen consisting of: (i) OXA + NF + anti-PD-1, (ii) OXA + HC + anti-PD-1, (iii) OXA + Spd + anti-PD-1. Chemotherapy consisted of one i.p. injection of the platinum salt OXA at day 0 (or PBS in untreated controls). Fasting lasted for 48 h starting at day −2. The CRM HC was continuously delivered through the drinking water starting at day −1. The CRM Spd was injected i.p. at day −1, 0, and then every 2–3 days. Anti-PD-1 neutralizing antibodies were administered i.p. at day 8, 12, and 16. Mean (b, f, j) and individual (c, d, g, h, k, l) tumor growth curves of mice treated with bi- and tri-therapies. Of note, mean tumor growth curves (n = 10–20/group) were interrupted when more than 50% of the group had reached endpoint. On the panels displaying individual tumor growth curves, the number of animals that underwent complete tumor regression is indicated on the right end side. Kaplan–Meier curves (e, i, m). +p< .05 (comparisons to OXA + anti-PD-1); $$$p< .0001, $$$p< .001, $$p< .01, $p < .05 (comparisons to OXA + CRMs/NF). Data of the groups PBS, OXA + HC, OXA + anti-PD-1 and OXA + HC + anti-PD-1 consist of a pool of two independent experiments. For a detailed account of all comparisons, see Supplemental Table 7. CRM, caloric restriction mimetic; HC, hydroxycitrate; i.p., intraperitoneal; NF, nutrient-free; OXA, oxaliplatin; PBS, phosphate-buffered saline; PD-1, programmed cell death protein 1; s.c., subcutaneous; Spd, spermidine.