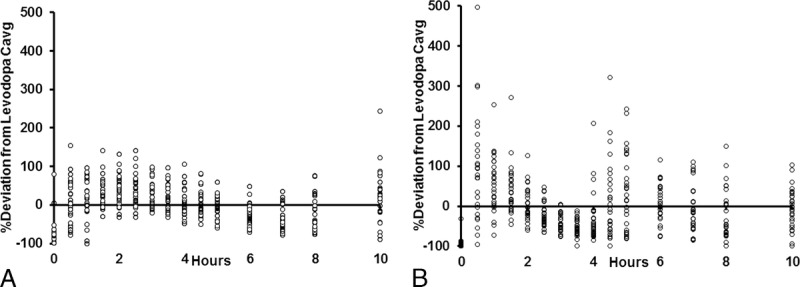
FIGURE 1.

Time course of percentage deviation from each patient's average LD concentration (Cavg) after (A) IPX203 and (B) IR CD-LD (N = 27).

Time course of percentage deviation from each patient's average LD concentration (Cavg) after (A) IPX203 and (B) IR CD-LD (N = 27).