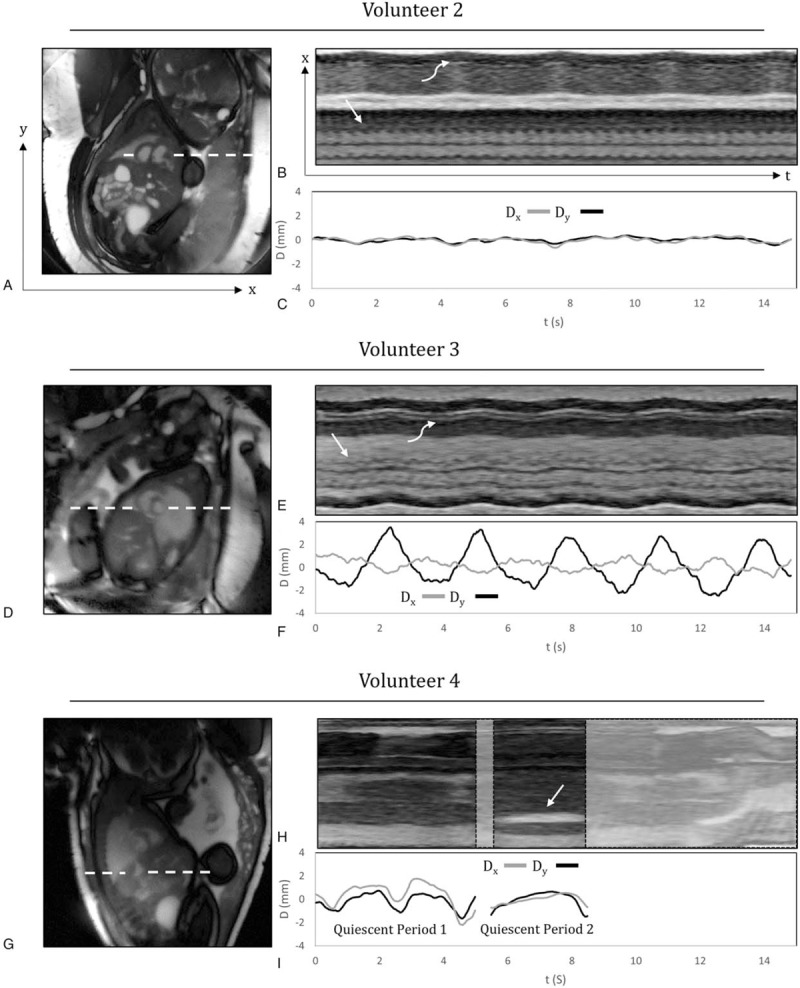
FIGURE 2.

Real-time reconstructions of the fetal heart for 3 volunteers with increasing levels of motion. Time-averaged images of the heart and surrounding anatomy (A, D, G), M-mode displays of signal along the white dashed lines (B, E, H), and plots of displacement (Dx,y) versus time (C, F, I), calculated from the real-time reconstructions over a region of interest containing the heart. Dx and Dy represent the horizontal and vertical components of displacement, respectively. For volunteers 2 and 3, the M-modes show fetal cardiac motion (straight arrow) and maternal respiratory motion (curved arrow). For volunteer 4, the M-mode display shows the fetal stomach (straight arrow), which is used to identify through-plane motion. Reprinted with permission from J Cardiovasc Magn Reson 2017; 19:29 used under CC BY. Caption adapted from the original.
