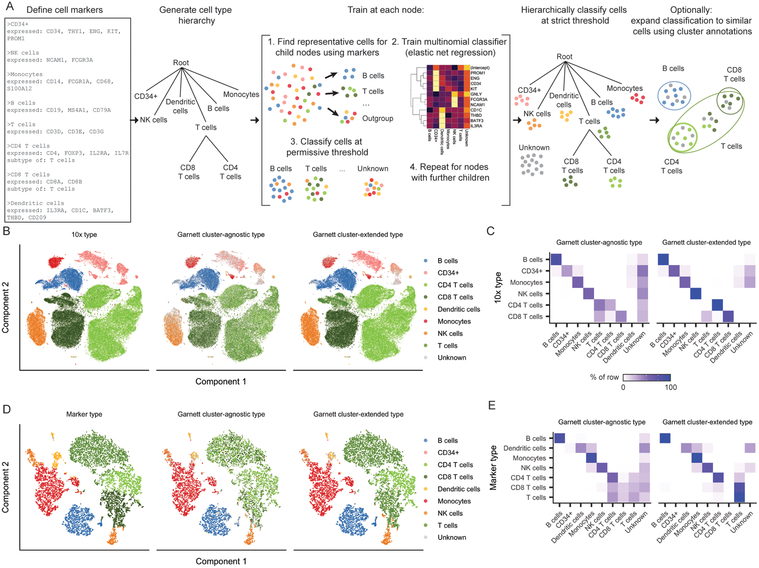
Figure 1. Garnett accurately classifies peripheral blood mononuclear cells.
A) Overview of Garnett algorithm. See Methods for algorithmic details. Briefly, Garnett takes as input a marker file that defines cell types using marker genes, and builds a cell type hierarchy that can include cell subtypes. Next, Garnett trains a classifier using elastic net multinomial regression17 at each node beginning at the root of the tree by comparing cell type representative cells. Lastly, Garnett hierarchically classifies all cells and optionally provides a second cluster-extended classification. B) t-SNE plots of 10x Genomics’ 100,000 cell PBMC dataset (n = 94,571 cells). The first panel is colored by cell type based on FACS sorting, the second panel is colored by cluster-agnostic cell type according to Garnett classification, and the third panel is colored by the Garnett cluster-extended type, which labels cells based on the composition of their cluster or community. C) A heatmap of data in (B) comparing the labels based on FACS (rows) with the cluster-agnostic (left) and cluster-extended (right) cell type assignments by Garnett (columns). Color represents the percent of cells of a certain FACS type labeled each type by Garnett. D) t-SNE plots of 10x Genomics V2 chemistry applied to PBMCs from a healthy donor (n = 8,381 cells). The first panel is colored by type determined manually using known gene markers. The second and third panels are colored by Garnett cluster-agnostic and cluster-extended cell type assignments by a classifier trained on the data shown in panels (B) and (C). E) Similar to panel (C), a heatmap of data in (D).

