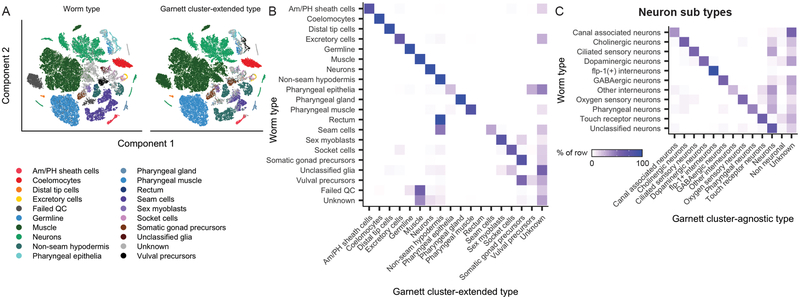
Figure 2. Garnett can discriminate among cell types across a whole animal, across species and between normal and pathological tissue.
Garnett classification results for sci-RNA-seq data from whole C. elegans, published in ref11. A) t-SNE plots of the whole worm dataset (n = 42,035 cells). First panel is colored by published type from ref11, second panel colored by the major (top level) Garnett cluster-extended classification. Garnett cluster-agnostic type is available in Supplementary Figure 7. B) Heatmap comparing the reported cell types versus the Garnett cluster-extended cell types. Color represents the percent of cells of a certain reported type labelled as each type by Garnett. C) Heatmap comparing the reported neuron subtypes versus the Garnett cluster-agnostic neuron subtypes.

