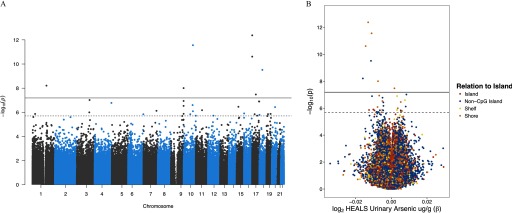
Figure 1.
Genome-wide associations between urinary arsenic concentration and CpG site–specific methylation in the Health Effects of Arsenic Longitudinal Study (HEALS). Using the EPIC () array, the association between urinary arsenic (creatinine adjusted) and methylation was evaluated at 771,192 CpG sites across 396 individuals from HEALS. (A) Manhattan plot of the chromosomal location and p-value for each CpG–arsenic association. (B) Volcano plot presenting association estimate and p-value for each CpG–arsenic association. Colors correspond to CpG relationship to island. In (A) and (B), solid and dashed lines designate the Bonferroni threshold () and false discovery rate (FDR) 0.05 threshold (), respectively.

