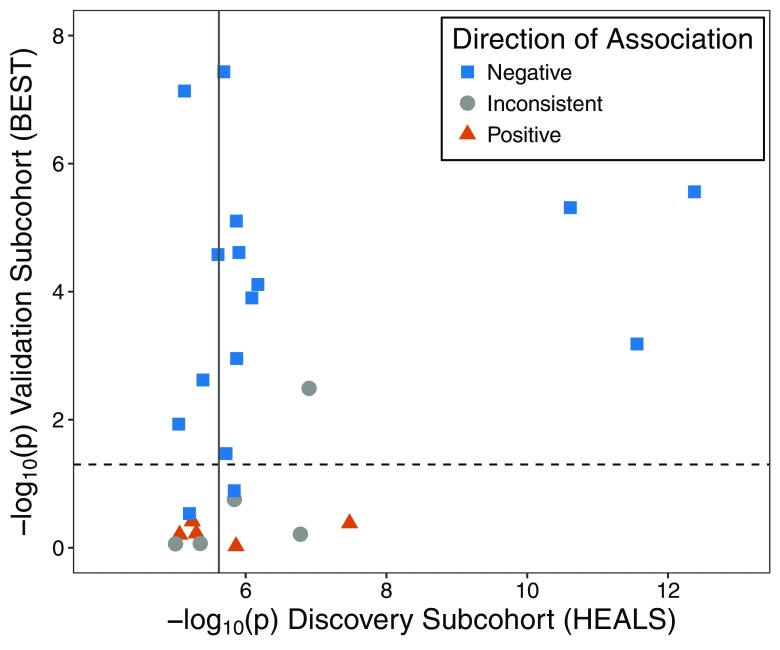
Figure 2.
Associations between urinary arsenic and CpG methylation discovered in the Health Effects of Arsenic Longitudinal Study (HEALS) and tested for replication in the Bangladesh Vitamin E and Selenium Trial (BEST). Using results from BEST, we attempted to validate 26 arsenic-associated CpGs that annotated to array among the 67 CpGs identified using the EPIC array in HEALS (). The BEST results consisted of associations between urinary arsenic and methylation evaluated for 390,810 CpGs using data on 400 BEST participants with existing array data. Horizontal dashed line represents , and solid vertical line corresponds to . Direction of association summarizes whether results from the cohorts are both positive (triangle), both negative (square), or inconsistent (directions of association differ) (circle). The corresponding results data are presented in Table 2 and Excel Table S1.

