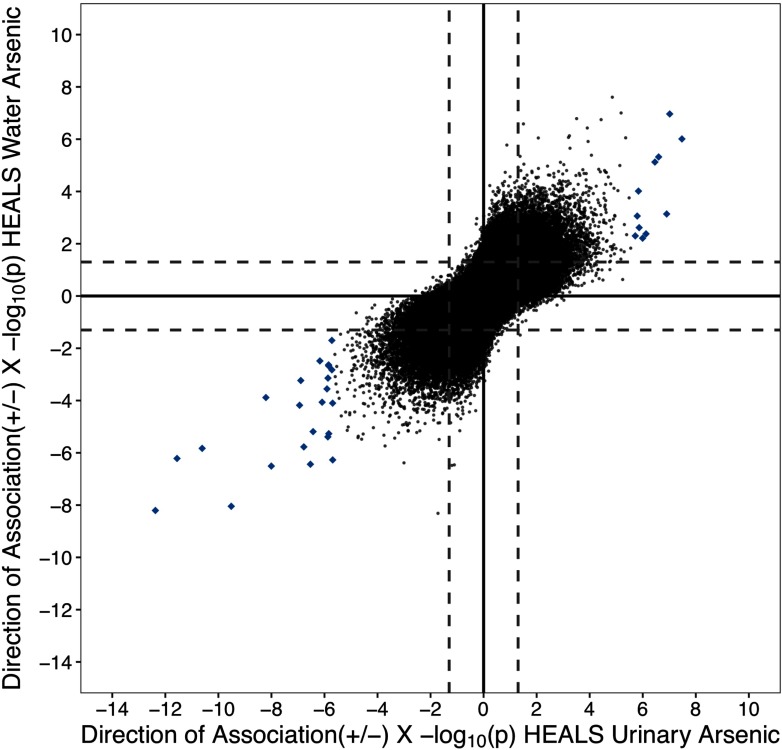
Figure 3.
Comparison between the associations of urinary arsenic and water arsenic with genome-wide methylation in the Health Effects of Arsenic Longitudinal Study (HEALS). The direction of association and for each CpG–arsenic association are plotted for urinary (x-axis) and water (y-axis) (both ). Solid lines and dashed lines designate and , respectively. CpGs highlighted in blue diamonds denote urinary arsenic–associated sites []. Pearson’s correlation between all urinary and water arsenic CpG associations was 0.67 ().

