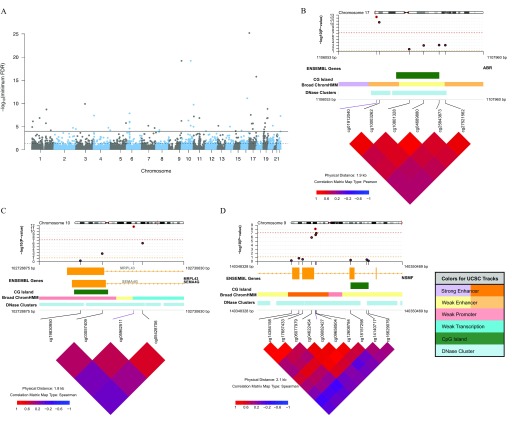
Figure 4.
Differentially methylated regions (DMRs) associated with urinary arsenic in the Health Effects of Arsenic Longitudinal Study (HEALS). Using 771,192 CpGs from the EPIC array, DMRs were identified using DMRcate ( base pairs and ). (A) Manhattan plot of the minimum false discovery rate (minFDR) for the CpG within all regions identified across EPIC array (no significance threshold set) ( regions). Solid and dashed lines designate minFDR of and minFDR of 0.05, respectively. (B–D) coMET plots of top three DMRs associated with urinary arsenic. Genomic annotations to gene, CpG islands, chromatin regulation, and DNase clusters are shown below each plot and are from UCSC CpG Island, UCSC DNase Cluster, and the Broad UCSC ChromatinHMM tracks (http://genome.ucsc.edu/, see coMET software documentation for further information and color coding) (Martin et al. 2015).

