Figure 5.
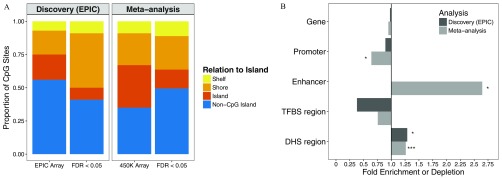
Enrichment of arsenic-associated CpGs among genomic features at . (A) Locational (with relation to island) distribution of arsenic-associated CpGs () from the Health Effects of Arsenic Longitudinal Study (HEALS) discovery analysis on EPIC array ( CpGs) and meta-analysis of HEALS and the Bangladesh Vitamin E and Selenium Trial (BEST) ( CpGs) compared with distribution of CpGs on entire EPIC () and () array, respectively. Colors correspond to CpG relationship to island. (B) Fold enrichment (FE) is plotted for each genomic feature comparing urinary arsenic–associated CpGs below FDR of 0.05 to the remaining CpGs. CpGs annotating to a promoter region were defined as those annotating to TSS200 or TSS1500. Abbreviations correspond to transcription factor binding site (TFBS) and DNase I hypersensitive site (DHS). P-values were obtained from comparing distribution of CpGs above and below FDR of 0.05 for each genomic feature [ (*), (**), and (***)].

