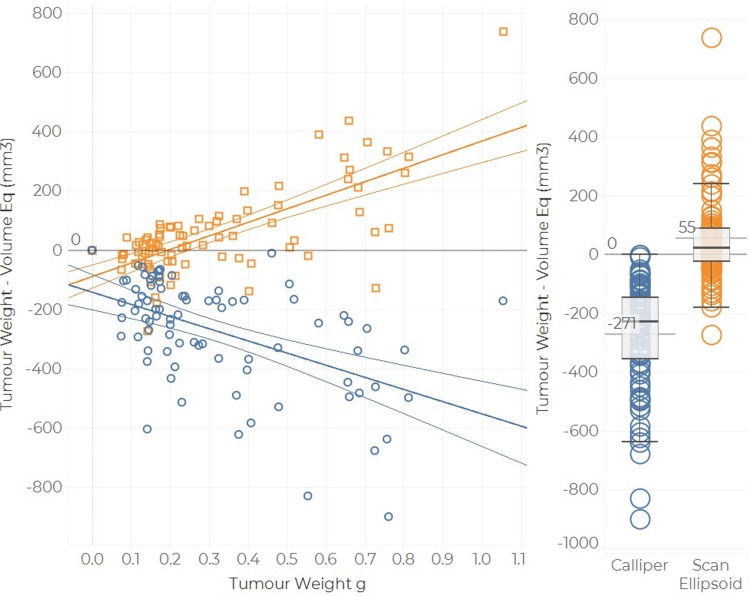
Fig 8. Volume—Weight comparison for Dataset 2.
Calliper volume was calculated using the spheroid formula, whereas scan volume corresponds to the ellipsoid volume. The linear fit is represented by the solid coloured lines, whereas the horizontal gray line is the 0 reference line. The boxplots display the median discrepancies. The hinges of each box show the 95% confidence intervals and the whiskers extend to 1.5 times the IQR.

