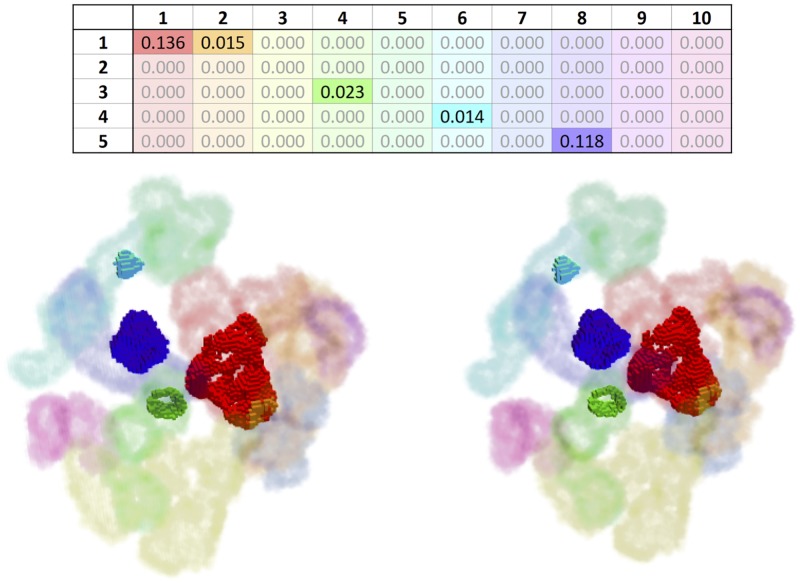
Fig 7. Overlapping matrix (top) and voxelized, cross-eyed stereoscopic 3D visualization of the protein 1A4U.
The example represents the overlap between 5 method-detected cavities (rows) and 10 ground-truth cavities (columns). The overlapped portions of the ground-truth cavities are rendered with opaque colors (true positives), and the non-overlapped portions as semi-transparent (false negatives). This example shows that the method detected roughly 13.6% of the first cavity (red), 1.5% of the second (orange), 2.3% of the fourth (light green), 1.4% of the sixth (cyan), and 11.8% of the eigth (purple).

