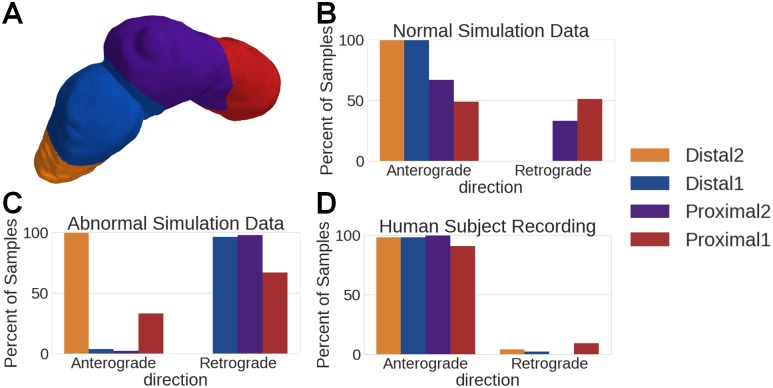
Fig 9. Wave direction histogram by stomach region, for time points in which PGD > 0.5.
A) Color coded stomach regions B) Normal data wave directions show strong anterograde wave propagation in all segments of the stomach. C) Abnormal data wave directions show strong retrograde wave propagation in the first distal and all proximal segments, while we see strong anterograde propagation in the distal 2 segment. This aligns with the simulation patterns. D) Human subject data wave directions show anterograde wave movement across all segments of the stomach, the strongest region being the distal 2 segment.

