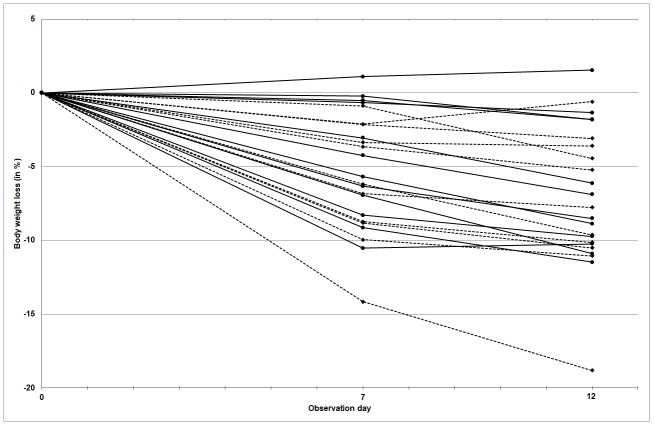
Fig 2. The proportional change (%) in body weight in individual cats from the control group and the experimental group.
Line segments connect measurements within the same cat to show the change of body weight in course of time. Dotted lines: individual cats without hiding boxes (control group). Solid lines: individual cats with hiding box (experimental group).

