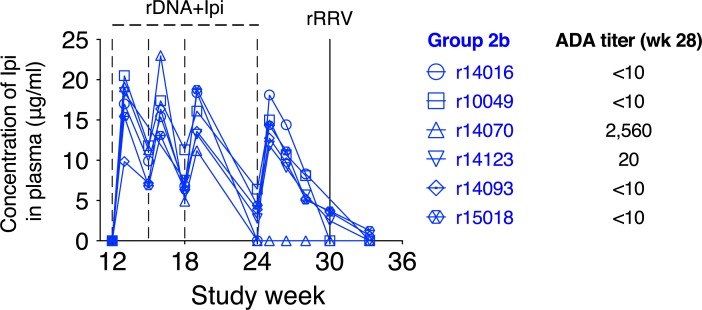
Fig 3. Pharmacokinetics of Ipi in the Group 2b vaccinees.
The concentration of Ipi was measured in plasma from the Group 2b animals at regular intervals during the vaccine phase. Each symbol denotes one vaccinee. Anti-Ipi antibodies were quantified in plasma collected at week 28. The endpoint titer of these anti-drug antibodies (ADAs) is shown next to its corresponding animal ID. The time scale in the x-axis matches that in Fig 1.

