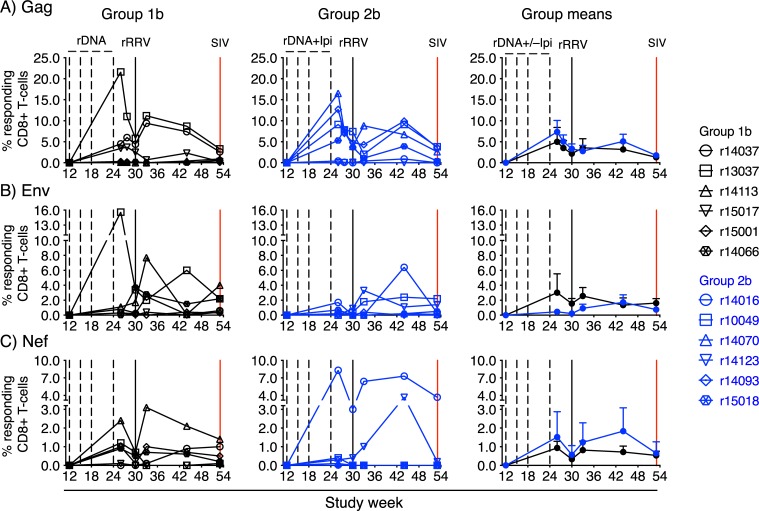
Fig 4. Kinetics of vaccine-induced CD8+ T-cell responses against Gag, Env, and Nef.
ICS was used to quantify vaccine-induced CD8+ T-cell responses against Gag (A), Env (B), and Nef (C) in Groups 1b (left column) and 2b (middle column) at multiple time points during the vaccine phase. Group means for these responses are shown in the right column. The error bars in the right panels correspond to the standard error of the mean and each symbol in the left and middle panels denotes one vaccinee. The time scale in the x-axes matches that in Fig 1. The percentages of responding CD8+ T cells shown in the y-axes were calculated by adding the background-subtracted frequencies of positive responses producing any combination of IFN-γ, TNF-α, and CD107a. To search for differences in vaccine-induced CD8+ T-cell responses over time between Groups 1b and 2b, mixed-effect quantile regression was performed, using time and group-by-time interactions as fixed effects, and individual differences as random effects. Significant group-by-time interactions were not observed.

