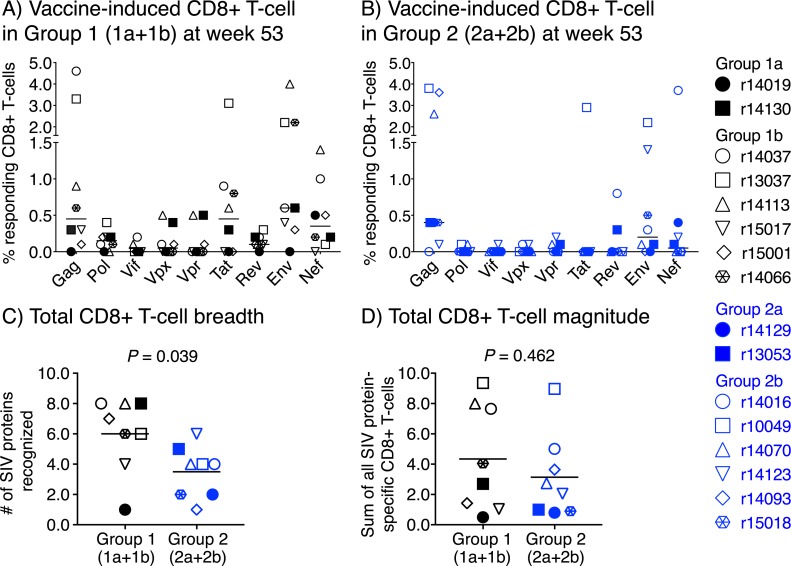
Fig 6. Total magnitude and breadth of vaccine-induced SIV-specific CD8+ T-cell responses at the time of SIV challenge.
A&B) The frequency of vaccine-induced CD8+ T-cells targeting each of the nine SIV proteins at week 53 is shown for each animal in Group 1 (1a+1b) (A) and Group 2 (2a+2b) (B). These data were used to calculate the total breadth (i.e., sum of all SIV proteins recognized; C) and total magnitude (i.e., sum of all SIV protein-specific responses; D) of SIV-specific CD8+ T-cell responses in each animal. C&D) Comparisons of the total breadth (C) and magnitude (D) of vaccine-induced SIV-specific CD8+ T-cell responses between Groups 1 and 2. Bars correspond to means and each symbol denotes one vaccinee. P-values were calculated using Welch’s t-test.

