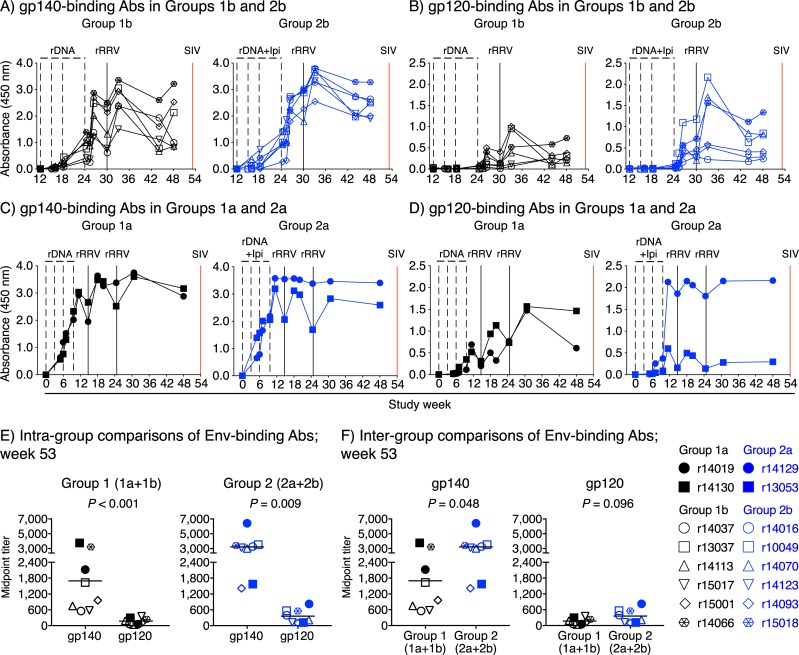
Fig 7. Vaccine-induced Env-binding antibody responses in Groups 1 and 2.
A-D) Env-binding antibodies (Abs) were measured by ELISA using plate-bound SIVmac239 gp140 (A&C) or gp120 (B&D) at multiple time points throughout the vaccine phase. Straight 1:1,000 dilutions of plasma from each vaccinee in Groups 1b and 2b (A&B) and Groups 1a and 2a (C&D) were used for this analysis. The time scale in the x-axes matches that in Fig 1) Serial dilutions of sera collected at week 53 were used to determine the midpoint titers of Env-binding Abs in Groups 1 and 2. E) Intragroup comparisons of gp140- and gp120-binding Abs at week 53. F) Intergroup comparisons of gp140- and gp120-binding Abs at week 53. Bars correspond to means and each symbol denotes one vaccinee. P-values were calculated using Welch’s t-test.

