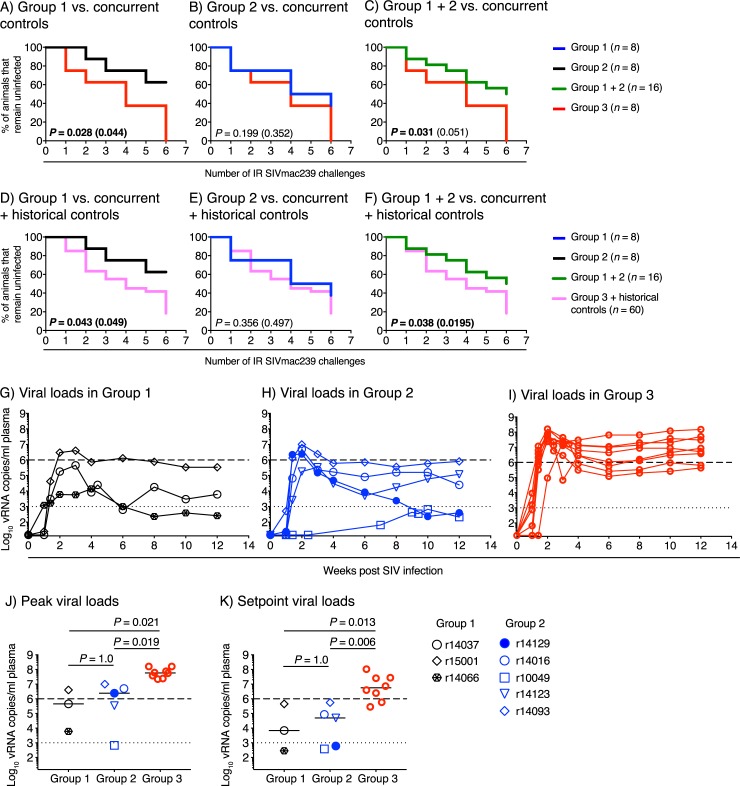
Fig 9. Outcome of SIV challenge.
Beginning at study weeks 53–54, all vaccinees in Group 1 (1a+1b) and Group 2 (2a+2b), as well as the eight unvaccinated control RMs in Group 3, were challenged every other week with a marginal dose (200 TCID50) of SIVmac239 via the IR route. Animals were re-challenged only if they remained aviremic after each exposure. Since all control RMs in Group 3 acquired SIV infection by the 6th challenge, the Group 1 and Group 2 vaccinees that remained uninfected at this point were no longer challenged. A-C) Kaplan-Meier analysis of SIV acquisition in vaccinees in Group 1 (n = 8; A), Group 2 (n = 8; B), and Groups 1 + 2 (n = 16; C) vs. the contemporaneous control animals in Group 3 (n = 8). D-F) Kaplan-Meier analysis of SIV acquisition in vaccinees in Group 1 (n = 8; D), Group 2 (n = 8; E), Groups 1 + 2 (n = 16; F) vs. the contemporaneous control animals in Group 3 (n = 8) plus historical control animals (n = 52). P values outside parentheses were determined using the Cox proportional hazard model. P values enclosed in parentheses were determined by Fisher’s exact test based on the number of infected and uninfected vaccinees versus controls after six SIV challenges. P values below 0.05 are in boldface type. G-I) Viral load (VL) kinetics in the SIV-infected RMs in Group 1 (G), Group 2 (H), and Group 3 (I). J&K) Comparison of peak (J) and setpoint (K) VLs between Group 3 and each vaccinated group. Peak VLs were determined as the highest VL measurement within the first 4 weeks after infection. Because of the unusually delayed VL kinetics observed in the Group 2 vaccinee r10049, its highest VL measurement at week 10 post infection (670 vRNA copies/ml) was considered as the peak VL for this animal. Setpoint VLs were calculated as the geometric mean of all VLs measured between weeks 8 and 12 post infection. Lines correspond to median values and each symbol denotes one vaccinee. ANOVA was used to search for group differences in log10-transformed peak and setpoint VLs. Significant group differences were found, so post-hoc pairwise comparisons were performed using Welch’s t test. The dotted lines in panels G-K are for reference only and indicate a VL of 103 vRNA copies/ml of plasma. The dashed lines in those panels are also for reference only and denote a VL of 106 vRNA copies/ml of plasma.

