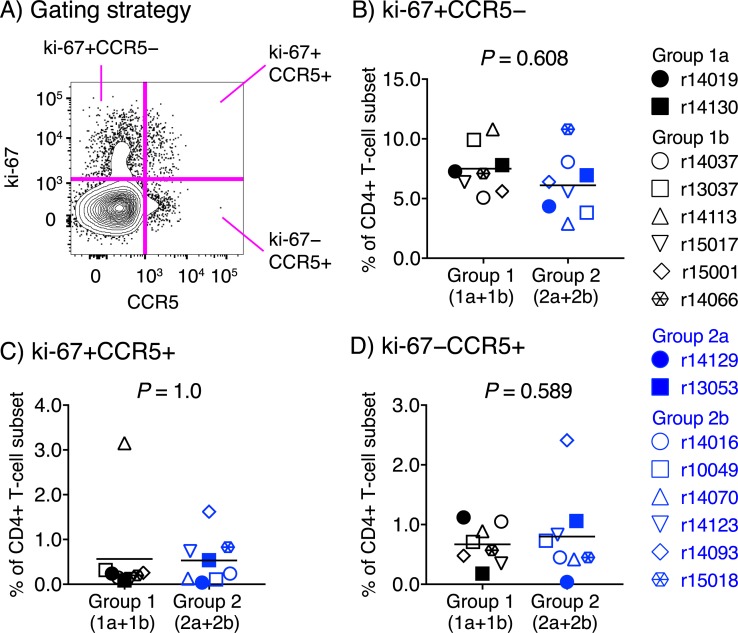
Fig 10. Pre-challenge frequencies of activated CD4+ T-cells in Groups 1 and 2.
Cryopreserved PBMC samples from the Group 1 (1a+1b) and Group 2 (2a+2b) vaccinees collected at study week 50 were thawed and used in flow cytometric assays to assess the expression of ki-67 and/or CCR5 on CD4+ T-cells. A) Gating strategy. Cells were gated on live CD14− CD16− CD20− CD3+ CD4+ CD8− lymphocytes. B-D) Comparisons of the frequencies of ki-67+CCR5−CD4+ T-cells (B), ki-67+CCR5+CD4+ T-cells (C), and ki-67−CCR5+CD4+ T-cells (D) between Groups 1 and 2. Lines correspond to mean values and each symbol denotes one vaccinee. P-values were calculated using median regression (see the Statistics section in Materials and Methods).

