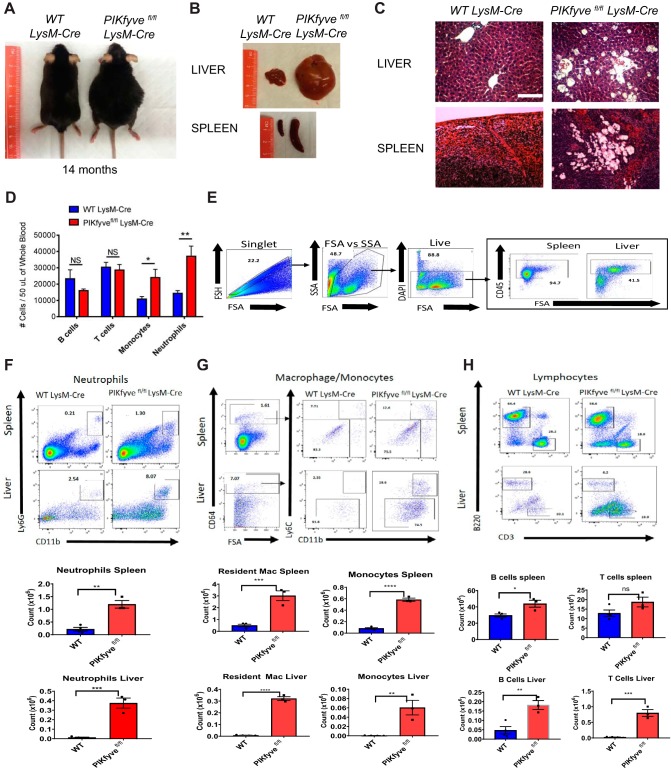
FIG 2.
PIKfyvefl/fl LysM-Cre mice display increased infiltration of inflammatory cells in various tissues. (A) General appearance of mice at about 14 months of age. Note the characteristic abdominal distention in the PIKfyvefl/fl LysM-Cre mouse. (B) Representative images of the liver and spleen of mice at 14 months of age, illustrating the marked hepatosplenomegaly in the PIKfyvefl/fl LysM-Cre mouse. (C) Representative images of tissue sections of the liver and spleen stained with hematoxylin and eosin. Note the tissue accumulation of engorged cells with translucent cytoplasmic vacuoles in the PIKfyvefl/fl LysM-Cre mouse. Scale bar: 100 μM. (D) Flow cytometry analysis of the numbers of B lymphocytes, T lymphocytes, monocytes, and neutrophils in the peripheral blood of mice at age of 4 to 20 weeks of age (n = 7 for WT LysM-Cre and n = 11 for PIKfyvefl/fl LysM-Cre). (E) Flow cytometry analysis of isolated leukocytes from the spleens and livers of WT LysM-Cre and PIKfyvefl/fl LysM-Cre mice. Left to right, general flow gating scheme (singlets, forward scatter [FSA]/side scatter [SSA], live) for all tissues and CD45 gating for spleen and liver off all live cells. (F) Flow cytometry gating for neutrophils (CD11b+ Ly6G+) for the spleen and liver along with cell number per tissue. (G) Flow cytometry gating for monocytes/macrophages first with CD64+, followed by monocytes (CD11b+ Ly6C+) and resident macrophages (CD11b+ Ly6C−) for the spleen and liver. (H) Flow cytometry gating for B lymphocytes (B220) and T lymphocytes (CD3). Statistical analysis was performed using unpaired two-tailed Student’s t test (NS, not significant [P > 0.05]; *, P < 0.05; **, P < 0.01; ***, P < 0.001; ****, P < 0.0001). All error bars indicate SEM.

