Figure 1.

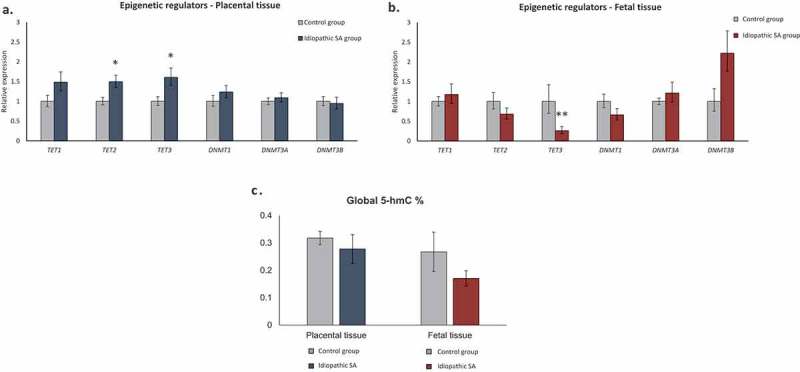
Relative expression of epigenetic regulators (TET1, TET2, TET3, DNMT1, DNMT3A and DNMT3B) in placental and fetal tissues. Bars represent 2ΔΔCt ± SEM; * represents p < 0.05, ** represents p < 0.01, *** represents p < 0.001. (a) Relative expression of epigenetic regulators in placental tissue from idiopathic SA (n = 19) comparing to controls (n = 16). (b) Relative expression of epigenetic regulators in fetal tissue samples from idiopathic SA (n = 19) comparing to controls (n = 16). (c) Global 5-hmC levels in placental and fetal tissues (controls, n = 8 and SA, n = 13). Bars represent 5-hmC (%) ± SEM.
