
Figure 4.
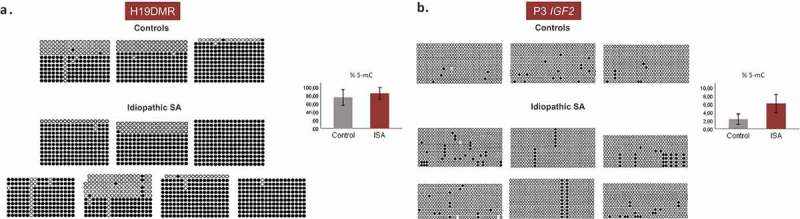
Methylation patterns of H19 DMR and P3 promoter IGF2 in fetal tissue samples by bisulfite genomic sequencing. The columns represent the successive CpGs and the rows represent the different clones. Black circles represent methylated CpGs and white circles represent non-methylated CpGs. The graph to the right represents the 5-mC (%) ± SEM of each group; ISA – Idiopathic spontaneous abortion. (a) Methylation status of 18 CpGs at H19 DMR in three fetal tissue samples of controls and seven fetal tissue samples of idiopathic SA. (b) Methylation status of 33 CpGs at P3 IGF2 in three fetal tissue samples of controls and six fetal tissue samples of idiopathic SA.