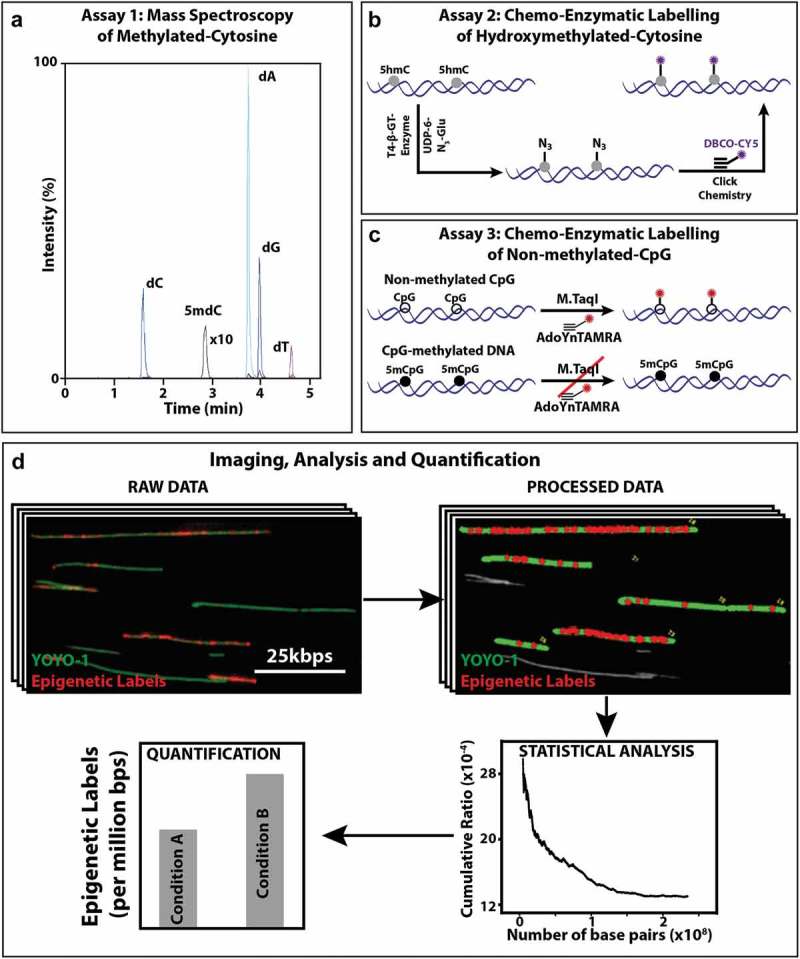
Figure 1.

Mass spectrometry and optical imaging techniques to quantify 5hmC and 5mC levels of DNA: (a) Assay 1: An MRM chromatogram of nucleosides obtained by hydrolysis of gDNA. (b) Assay 2: Schematic representation of the two-step 5hmC labelling reaction. First, T4 β-GT enzymatic glucosylation of 5hmC with UDP-6-N3-Glu is performed. Next, click reaction between the N3 group and the fluorescently labelled alkyne DBCO-Cy5 is performed. This two-step reaction results in fluorescently labelled 5hmC. (c) Assay 3: Schematic representation of M.TaqI mediated labelling of non-methylated cytosines: Top: M.TaqI catalyzes the transfer of a TAMRA fluorophore from the cofactor AdoYnTAMRA onto the adenine residue that lies in its TCGA recognition site. Bottom: If the cytosine residue that lies within M.TaqI’s recognition site is methylated, the reaction is blocked. (d) Multiple fluorescence microscopy images are obtained per sample, showing both YOYO-1 labelling of the entire DNA molecule (green) and the epigenetic-labels (red dots). In-house developed user interface of the image processing software, where the length of the DNA molecules is measured (green) and colocalized epigenetic-labels (red dots) are detected and subsequently quantified relative to DNA length. Output of the statistics tool, showing the total length of DNA (in bps) and the percentage of epigenetic-labels relative to DNA. Illustrative bar graph comparison of the number of epigenetic labels between two conditions.
