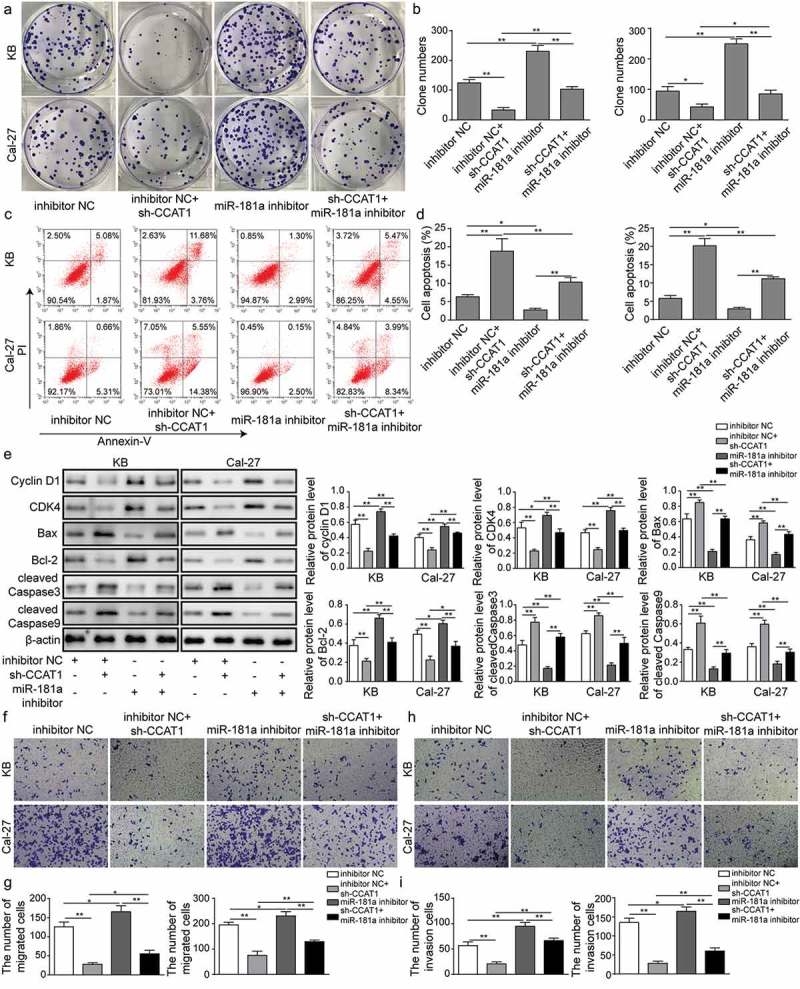
Figure 4.

Effects of sh-CCAT1 and miR-181a inhibitor on OSCC cells. (a–b) Colony formation of cells. Cells were transfected with sh-CCAT1 and/or treated with miR-181a inhibitor. (c–d) Cell apoptosis detected with flow cytometry. (e) Expression of proteins that regulated cell cycle and apoptosis determined with western blot. (f–i) Cell migration and invasion measured with transwell assay. Data are means ± SD. *, p < 0.05, **, p < 0.01.
