Figure 6.

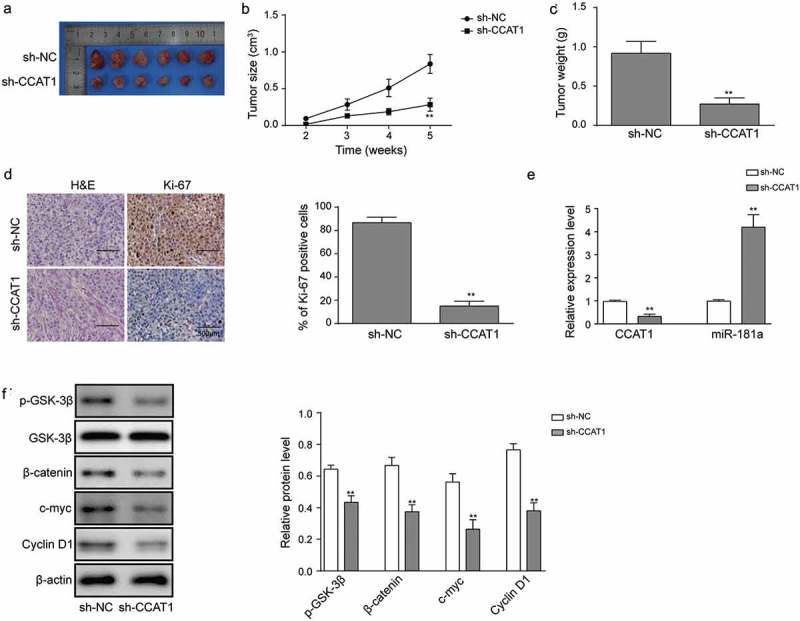
Effects of sh-CCAT1 on tumor growth in vivo. (a) Representative images of tumor tissues after 5-week. (b) Tumor size measured at each week. (c) Tumor weight measured after 5-week. (d) Ki-67 expression visualized with H&E/IHC staining. (e) The level of CCAT1 and miR-181a in OSCC tissues. Relative expression was assayed using qRT-PCR. (f) Expression of the proteins in Wnt signaling determined with western blot. Data are means ± SD. *, p < 0.05, **, p < 0.01.
