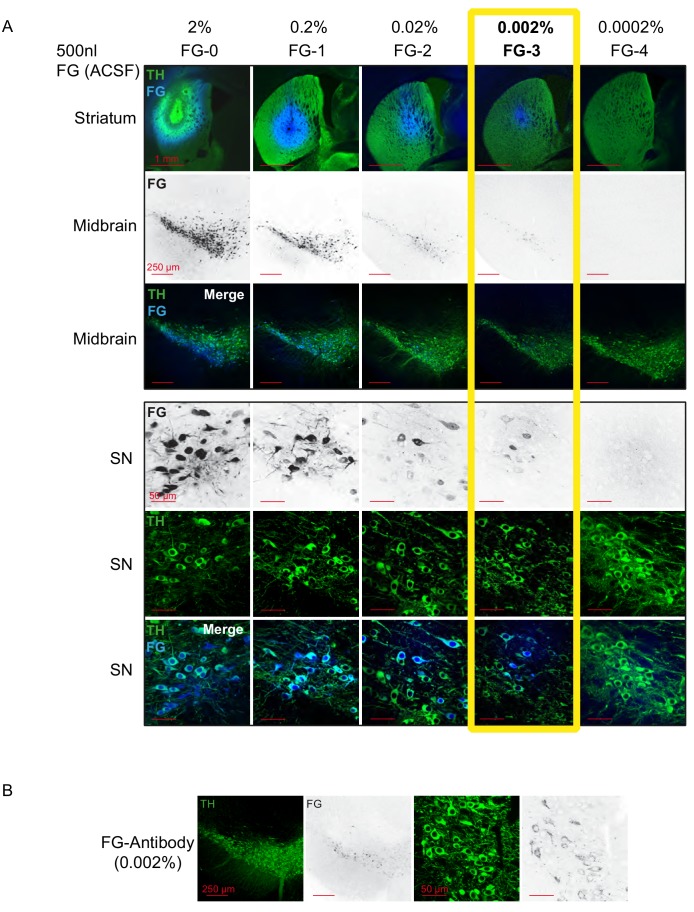
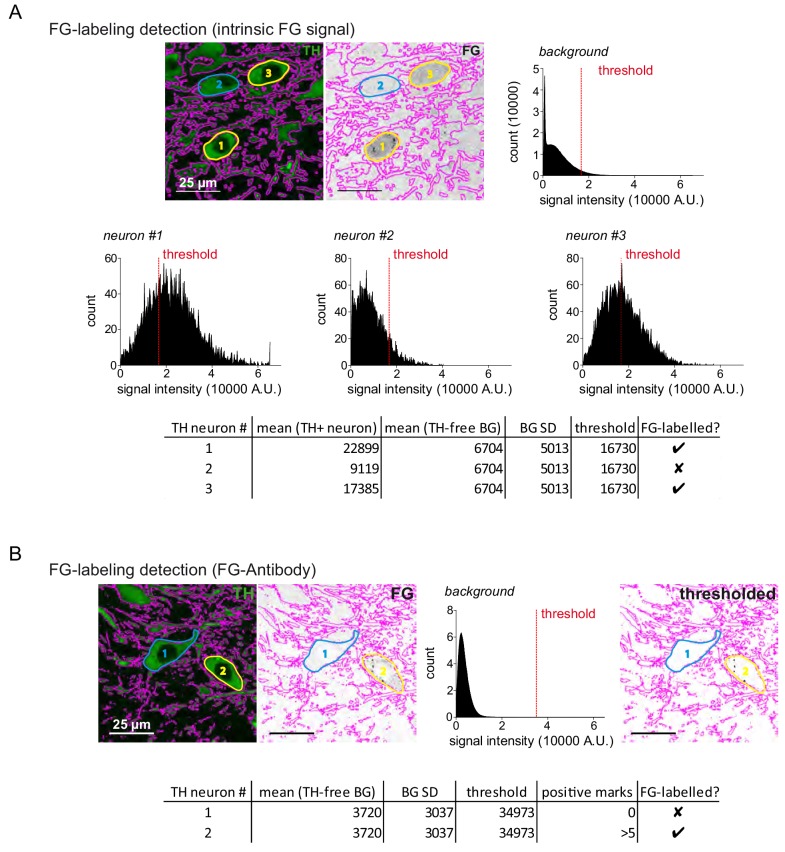
Figure 1. 1000-fold reduction of conventional FG-concentrations leads to intact FG-labelled DA neurons in vivo.
(A) Confocal images of a dilution series of Fluorogold/ACSF injections. (Top panel, 1st row) merged images of injections sites (4x magnification) in dorsal striatum with TH in green and FG in blue. (2nd and 3rd row) 10x images of retrogradely traced neurons (FG black in the 2nd row and blue in the 3rd row) in the midbrain (TH green) at bregma −3.16 mm (10x magnification). (Bottom panel) Images of retrogradely traced SN DA neurons at higher magnification (60x; FG black in the 1st row and blue in the 3rd row, TH green). Note that 0.002% FG constitutes the lowest detectable concentration. (B) Use of FG-Antibody facilitates identification of FG-labelled neurons after 0.002% FG/ACSF infusion. Note the increased detectability in comparison to the intrinsic FG signal after 0.002% infusion of FG (Figure 1A, column four).


