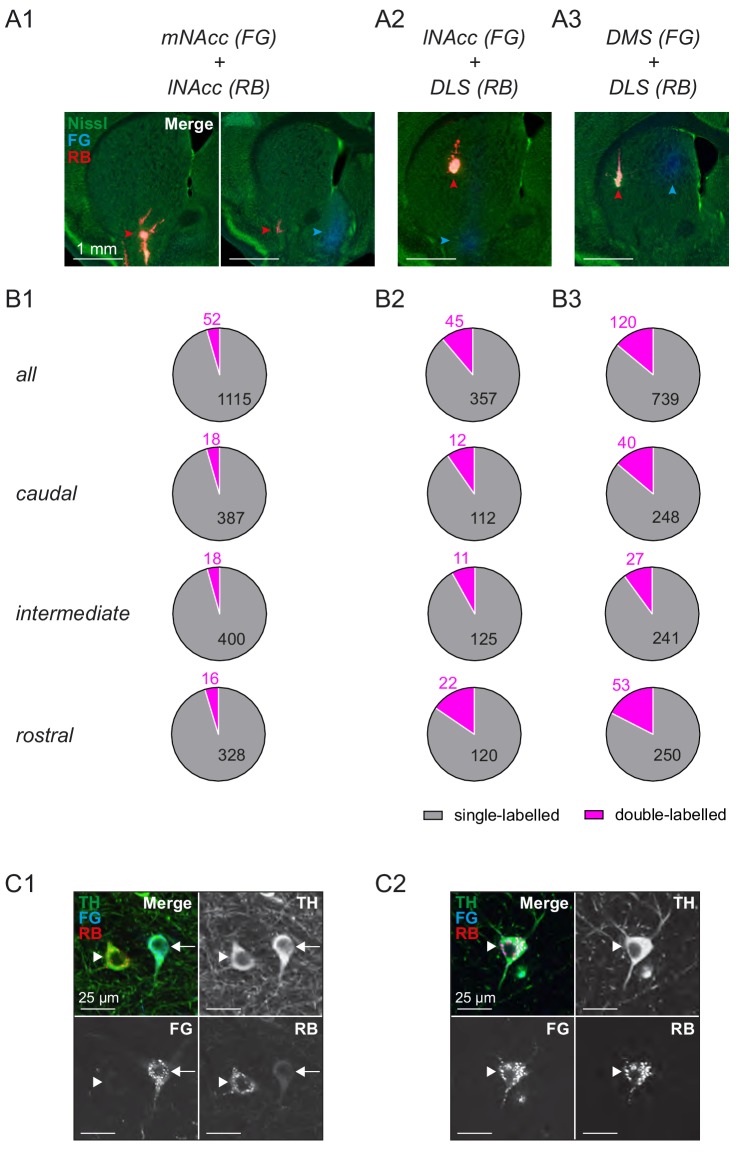
Figure 5. Projection-defined midbrain DA systems projecting to dorsal and ventral striatum are predominantly parallel and non-overlapping.
(A) Infusion sites in green nissl counterstained 100 μm sections of double retrograde tracing experiments using fluorogold (blue) for mNAcc (A1), lNAcc (A2) and DMS (A3) and red fluorescently labelled latex beads (red) for lNAcc (A1) and DLS (A2 and A3). Arrowheads indicate the respective infusion sites. (B) Distribution of single-labelled and double-labelled DA neurons for each double tracing experiment (single-labelled in grey, double-labelled in magenta). Numbers indicate accumulated total numbers of neurons counted (first row, N = 3 per group), as well as those in caudal sections (−3.64 mm from bregma; second row), intermediate sections (−3.28 mm from bregma; third row) and rostral sections (−3.08 mm from bregma; fourth row). (C) Confocal images of TH-positive (green) cells in the m-SN labelled with fluorogold (blue) for lNAcc neurons and red beads (red) for DLS neurons. (C1) Example of two neighboring single-labelled neurons. (C2) Example of a double labelled neuron.

