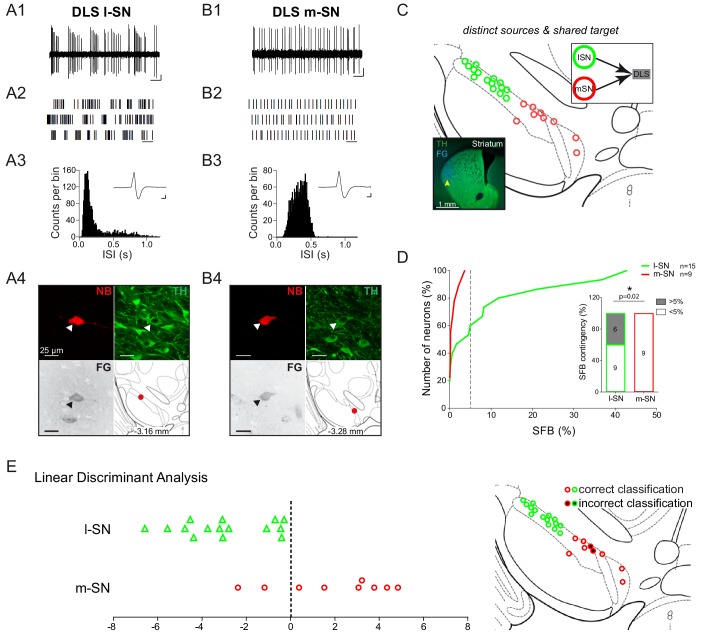
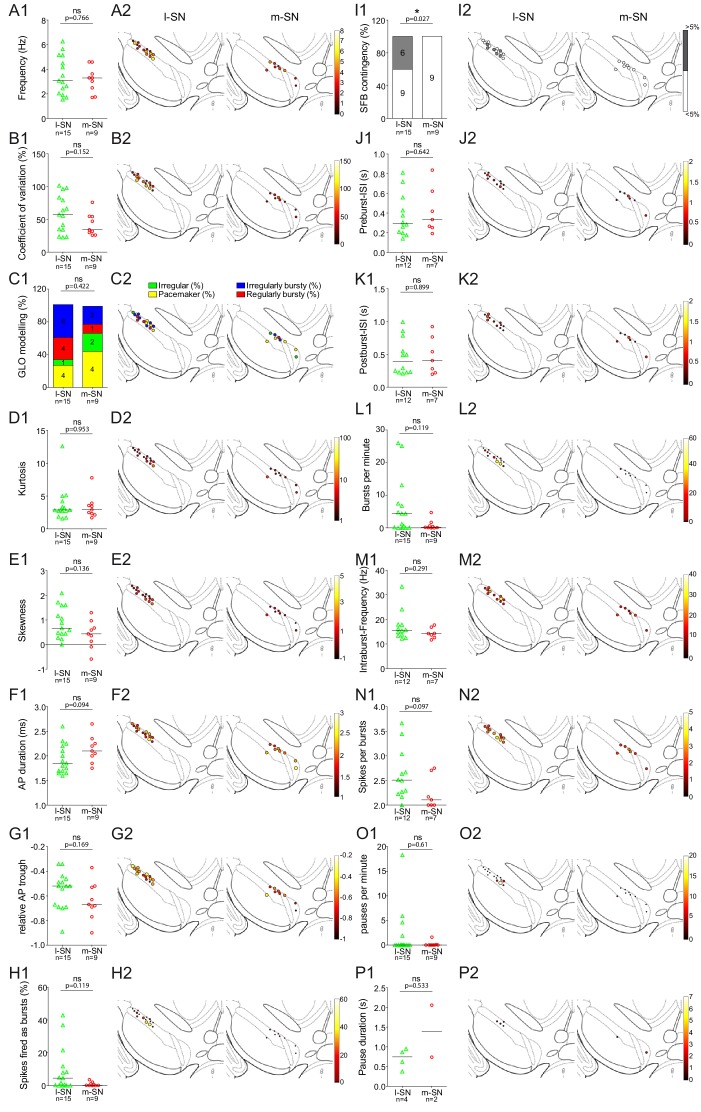
Figure 6. High in vivo burstiness in lateral compared to medial DLS-projecting SN DA neurons.
(A1, B1) Spontaneous in vivo extracellular single-unit activities of a representative DLS-projecting DA neuron located in the lSN (A1) and a representative DLS-projecting DA neuron located in the mSN (B1), shown as 10 s of original recording traces (scale bar: 0.2 mV, 1 s). Note the differences in burstiness. (A2, B2) 30 s raster plots (scale bar: 1 s). (A3, B3) ISI-distributions. Note the presence of ISIs below 80 ms and 160 ms indicating bursts in A3 in contrast to B3. Inset, averaged AP waveform showing biphasic extracellular action potentials in high resolution (scale bar: 0.2 mV, 1 ms). (A4, B4) Confocal images of retrogradely traced, extracellularly recorded and juxtacellularly labelled DA neurons, the location of the neurons is displayed in the bottom right images. (C) Anatomical mapping of all extracellularly recorded and juxtacellularly labelled neurons (projected to bregma −3.16 mm; DLS-lSN in green, DLS-mSN in red). Inset, FG-injection site in DLS (FG in blue, TH in green). (D) Cumulative SFB distribution histograms (dotted line at SFB = 5% threshold) and bar graphs of SFB contingencies (% of neurons > and < 5% SFB) showing significant differences in burstiness. Note that no DLS-projecting DA neurons located in the mSN displayed a SFB above 5%. (E) Linear discriminant analysis of DLS-projecting DA neurons located either in the mSN or lSN. (Right Picture) Mapping of correctly- vs incorrectly-classified DLS-projecting DA neurons located in mSN or lSN.


