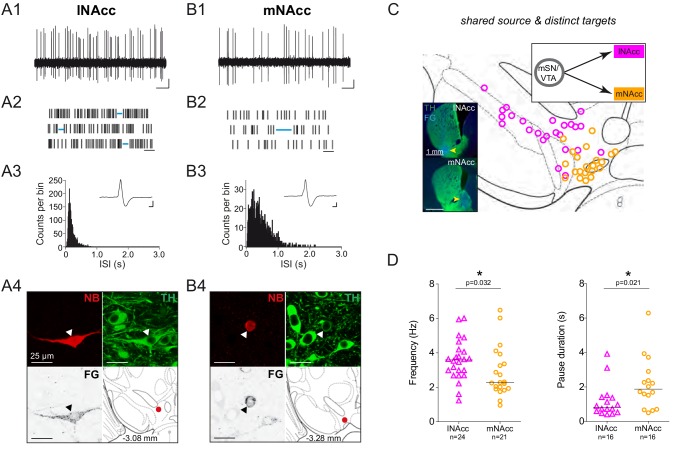
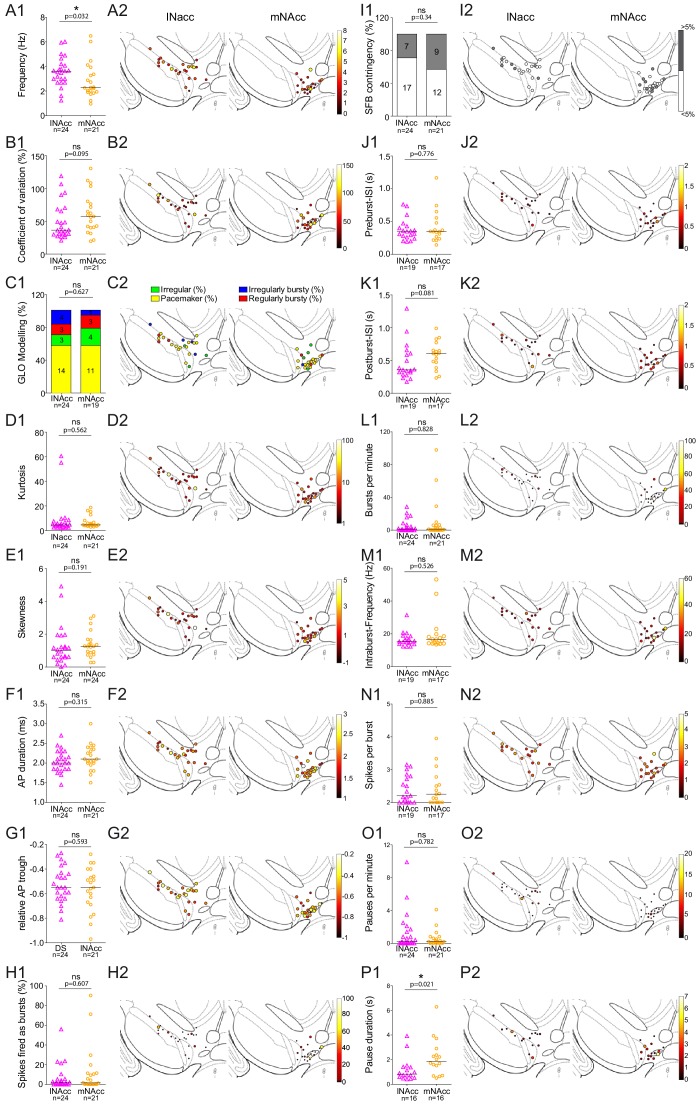
Figure 8. DA neurons projecting to medial or lateral shell of the nucleus accumbens display distinct in vivo firing rates.
(A1, B1) Spontaneous in vivo extracellular single-unit activities of a representative lNAcc-projecting DA neuron located in the mSN (A1) and a representative mNAcc-projecting DA neuron located in the VTA (B1), shown as 10 s of original recording traces (scale bar: 0.2 mV, 1 s). Note the differences in firing frequency. (A2, B2) 30 s raster plots (scale bar: 1 s). Blue lines indicate pauses. Note the differences in pause duration. (A3, B3) ISI-distributions. Note the differences in overall shape and maximal ISIs. Inset, averaged AP waveform showing biphasic extracellular action potentials in high resolution (scale bar: 0.2 mV, 1 ms). (A4, B4) Confocal images of retrogradely traced, extracellularly recorded and juxtacellularly labelled DA neurons, the location of the neurons is displayed in the bottom right images. (C) Anatomical mapping of all extracellularly recorded and juxtacellularly labelled neurons (projected to bregma −3.16 mm; lNAcc in magenta, mNAcc in orange). Insert, FG-injection sites in lNAcc and mNAcc (FG in blue, TH in green). (D) Scatter dot-plots (line at median) showing significant differences in firing frequency (Hz) and pause duration (s).


