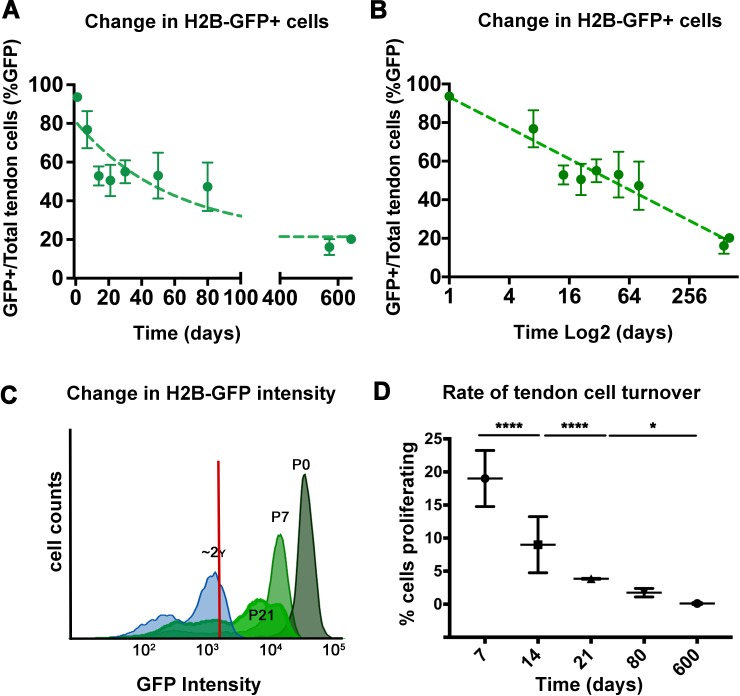
Figure 2. Analysis of H2B-GFP+ cells from postnatal to aged stages.
The percentage of H2B-GFP+ tendon cells decreases from P0 to P645, with a rapid decline of H2B-GFP+ tendon cells by 14 days post birth and a more graduate decrease in H2B-GFP+ cells from P14 to P645 (A). Analysis of H2B-GFP+ tendon cells shows logarithmic decay (log2) in the percentage of H2B-GFP+ cells (B). H2B-GFP+ tendon cells decrease in their intensity of GFP from P0 to P645 (C; stages examined are labeled and shown with different shades of green; histogram is a representative from n = 4 mice). Using the change in H2B-GFP intensity, a model was used to calculate the daily cell proliferation rates (D), which shows significantly higher proliferation rates from P0 to P21, and lower proliferation rates at P80 and P600. Tendons from n > 3 mice were examined per each stage shown on the graph. All error bars represent standard deviation.

